🚀 PRTG Trending & Baselining Tool
Enables powerful trending insights in your PRTG Network Monitor.
- Capacity management for any PRTG sensor
- Integrated with PRTG Maps and Reports
- Visual GUI views for NOC operators
📊 Overview
PRTGPluginsGUI complements our PRTGPlugins suite with advanced Baselining and Trending capabilities using data from any PRTG sensor.
The tool helps anticipate resource saturation based on configurable measurement periods:
- Long term: 1, 3, 6 months
- Short term: 7 days, 2 weeks, 1 month
🔧 Operation Modes
- Dash Board Mode – Visualize live and historical data using predefined views. Works with read-only PRTG access.
- Map Integration Mode – Use the trending graphics directly inside PRTG Maps for enhanced visibility.
- Reporting Integration Mode – Add trend graphics and data into native PRTG reports (7d/30d templates provided).
🖥 System Requirements & Setup
- Install on a dedicated PRTG Remote Probe (not internet-facing)
- .NET Framework 4.5+ required (3.5 also recommended for full compatibility)
- PRTGPluginsGUI should be placed in:
Custom Sensors\EXEXML - Create a
.iniconfiguration file to define your trending views - Ensure file permissions for PRTGProbe (e.g., access to
\Webroot\mapobjects) for reporting & maps
📁 View Configuration Parameters
- Sensor ID: Unique ID of the PRTG sensor (from browser URL)
- View Type: e.g., 0 = Baseline, 7/14/30/90 = Trend days
- Polling Interval: Refresh time in minutes
- Include / Exclude Channels: Comma-separated channel names
- Y-Axis / X-Axis Titles: Customize chart labeling
- Trend Lines / Show Legend: On/Off options per view
📊 Sensor Output Interpretation
Each data channel includes 3 values:
- 0-ChannelName: Starting value (past)
- 1-ChannelName: Current trend value (today)
- 2-ChannelName: Projected value (future)
This gives a full backward and forward-looking view within a single sensor.
🗺 PRTG Map & Report Integration
- Create a Custom EXE/Script Advanced Sensor in PRTG
- Use parameters like:
-i:"C:\path\to\your.ini" -v:0 -o:30 -s:%sensorname -mp
- Enable report integration by including these sensors in the default or custom templates
⚠️ Limitations
- Max 16 channels per view (up to 32 lines visualized)
- Max 50 views per INI file
- Grouped views in PRTG only supported in Baseline mode (no historic data)
📥 How to Get It
Status: Beta – most bugs have been fixed.
- Download Admin Guide from Documentation
- Download Setup Files from Tools files
- Download Reporting Templates from the same page
Request a 2-day trial license – instantly sent via email. Can be requested repeatedly.
👥 Target Audiences
- NOC teams: Real-time baseline views on big screens
- IT managers: Long-term service monitoring and planning
🧭 Use Modes
1. Graphical Views for Trending
Ideal for NOC dashboards and management trend forecasting:

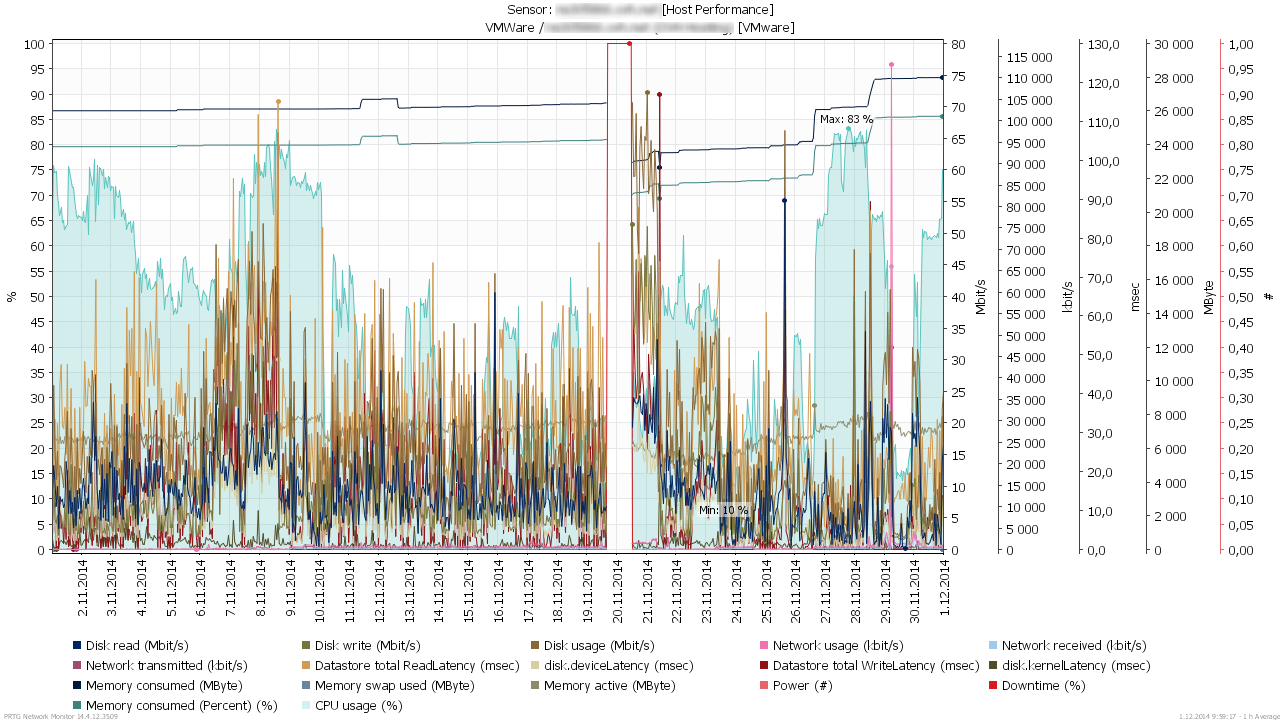
Example 1: PRTG 30-day native view
Example 2: PRTGPluginsGUI 30-day view without trend lines
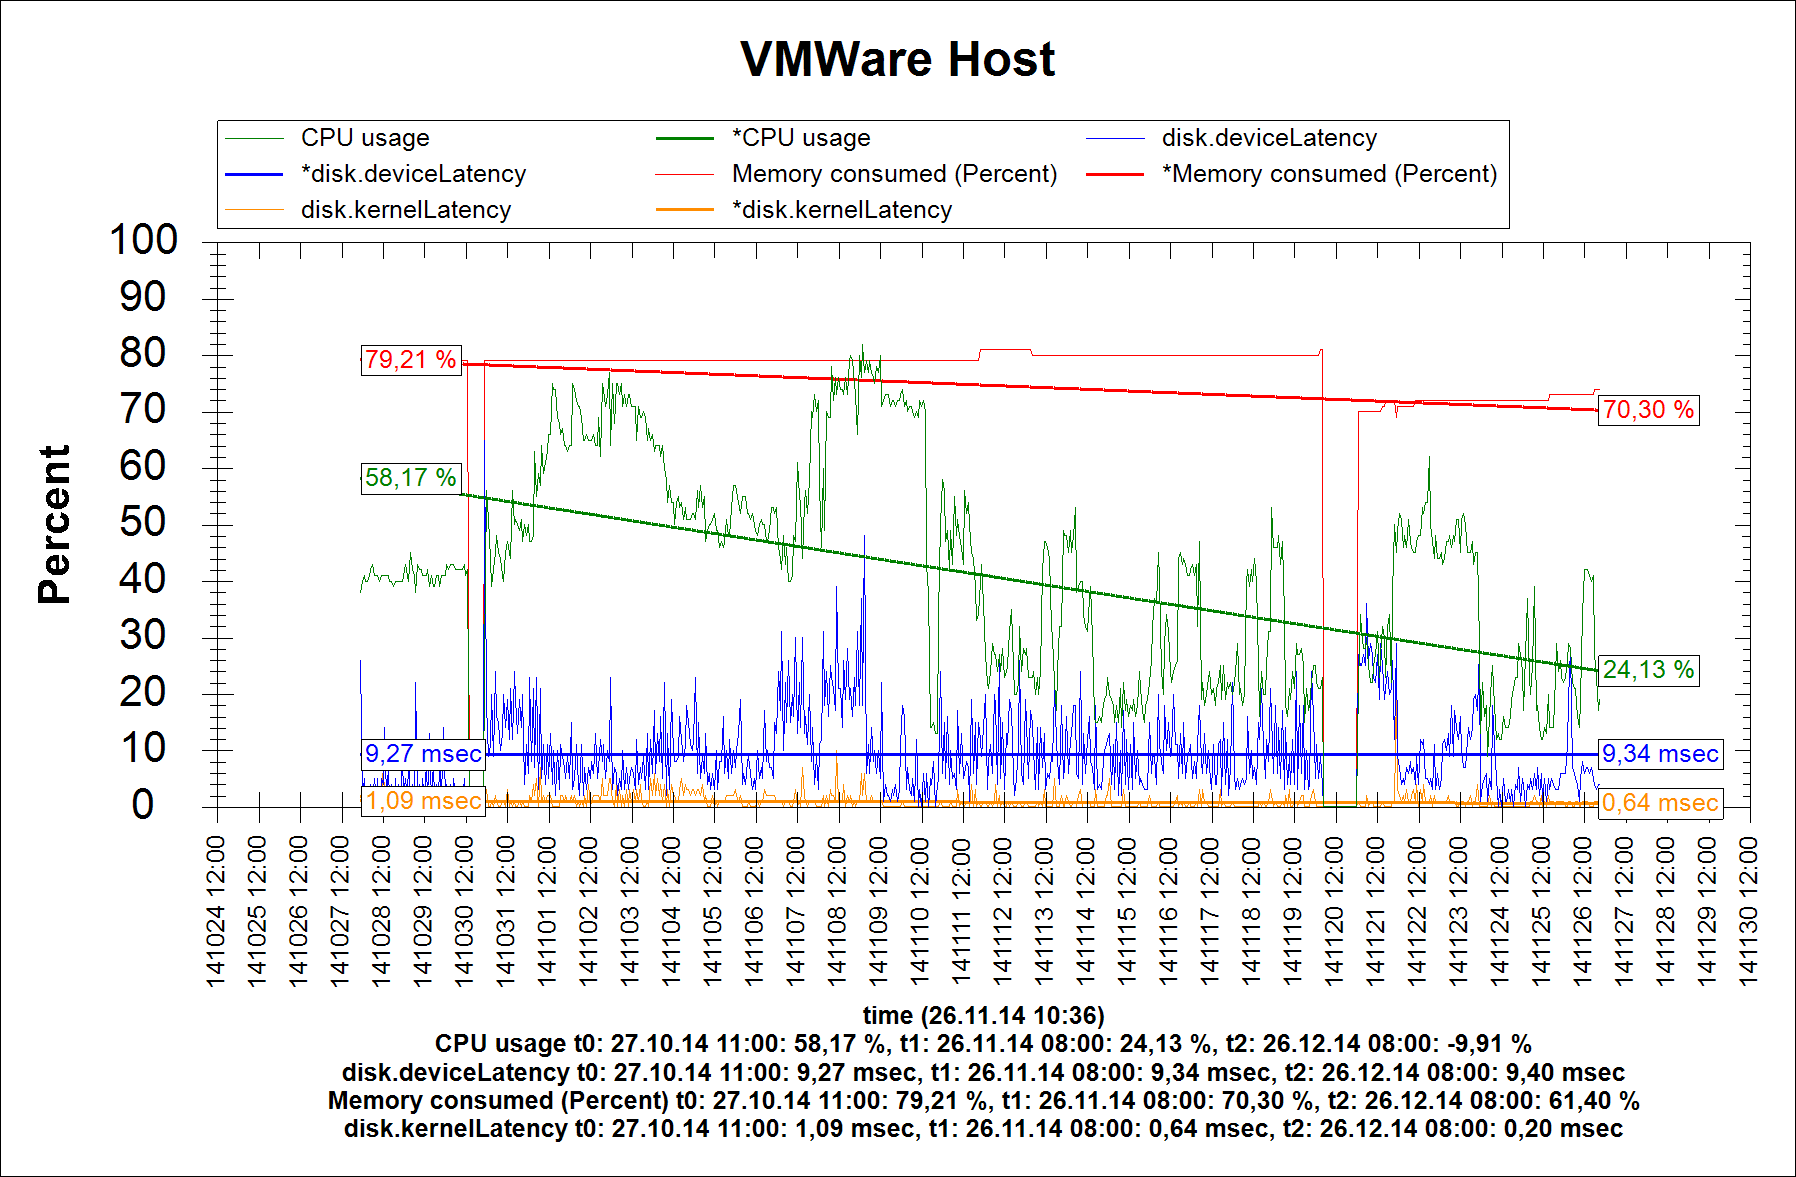
Example 3: Same with trend lines


2. Loop-Back Data to PRTG
Send calculated trend data back to PRTG for historical reporting and dashboards:

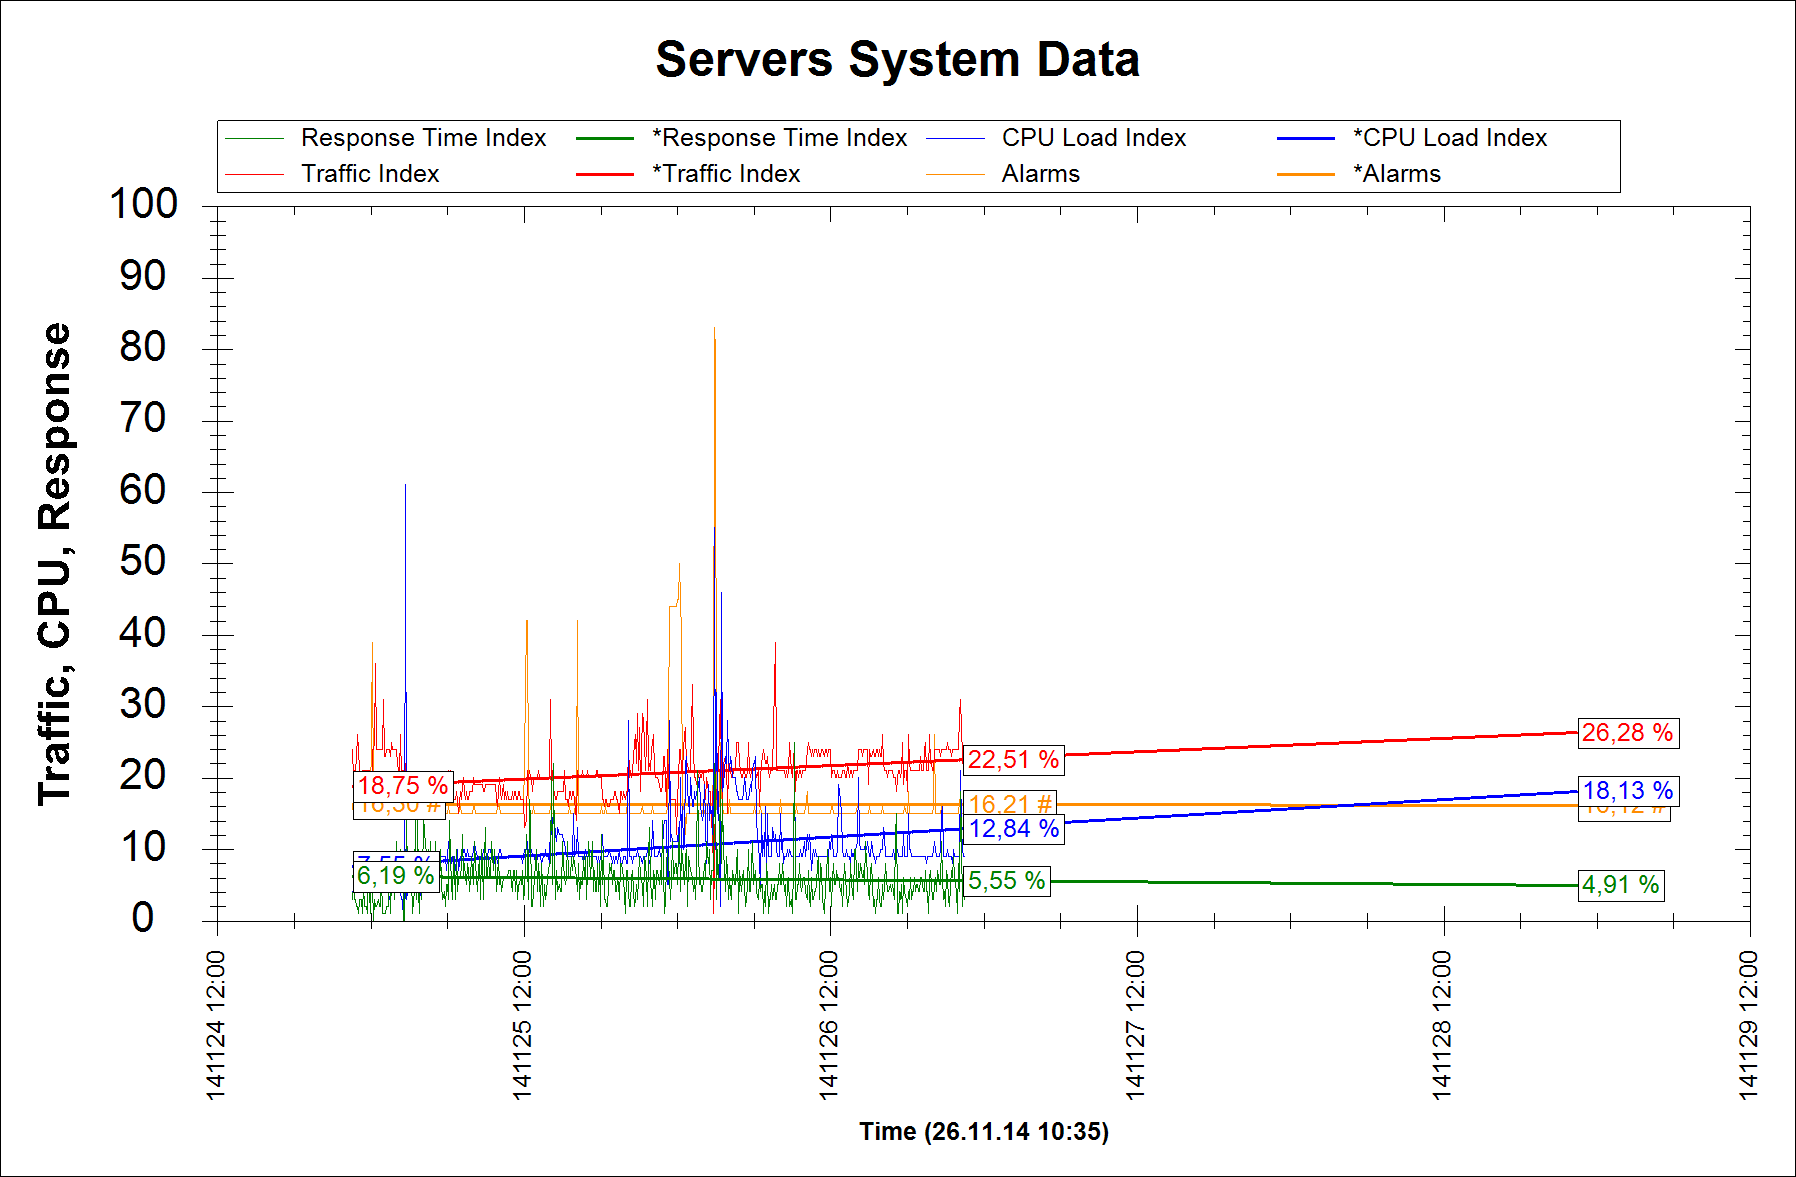
Example: Looping 7 and 14 day data to PRTG from a different view type:

3. Online Graphics for PRTG Maps
Feature under development – coming soon.