
One workspace for operational foresight
Trends Explorer brings the full lifecycle together: discover useful signals, build service-level Views, define channel objectives, review AI proposals, validate readiness, deploy the approved result and keep the forecast visible in PRTG.
See direction
Understand whether a value or service is improving, stable or moving toward risk.
See uncertainty
Forecast ranges, data coverage and confidence show how much trust the result deserves.
See the service
Combine related sensors and channels into one reusable operational View.
From sensor lists to operational Views
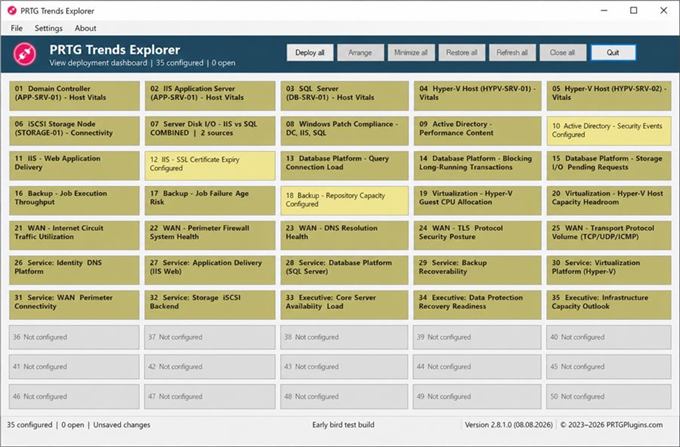
Build Views around a component, capacity question, application or complete service. A View can use one source or combine multiple sensors and channels on a common timeline while retaining traceability to the original PRTG objects.
- Single-source and combined multi-sensor Views
- Per-channel participation and analysis model
- Service, capacity, performance and diagnostic perspectives
- Movable chart windows and a fast dashboard overview
Your SLA and operational objectives — translated into governed, measurable monitoring and trends
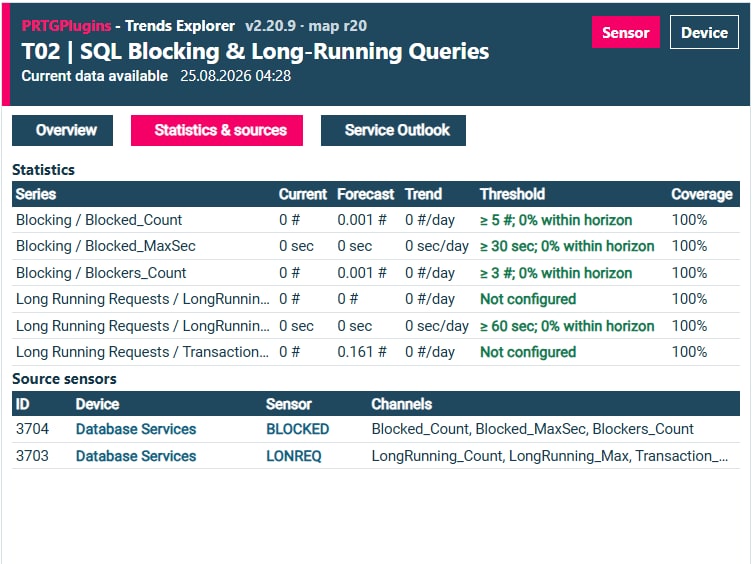
Turn agreed SLA commitments and operating policies into governed objectives for the PRTG channels that define and evidence the service — availability, latency, capacity, backlog, error rate, backup age or any other relevant signal already present in your monitoring. Each approved objective records what good looks like: the expected direction, threshold, bounds, forecast model and the evidence behind the decision. Trends Explorer then turns that objective into foresight: when is the limit likely to be crossed, how much time remains and what is the probability of a breach within the selected forecast horizon?
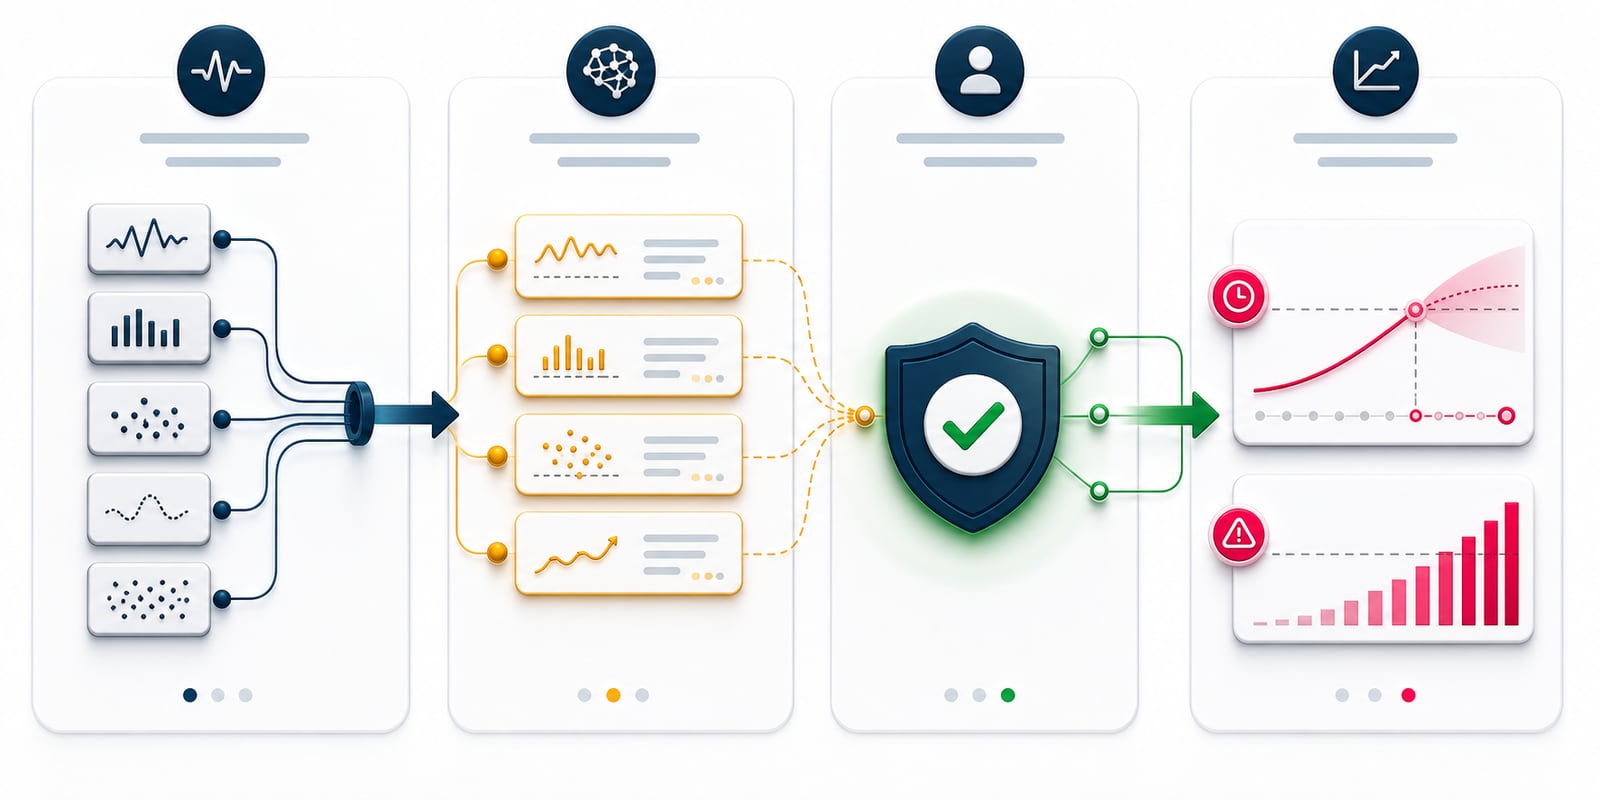
From policy to action: qualifying sources gain Days to threshold and Breach probability outputs. The same governed result is available as statistics and as a clear Service Outlook message in PRTG Maps. Maintenance-policy interpretation is available for review; actual-event correlation, achieved availability and remaining downtime-budget calculation remain separate future work.
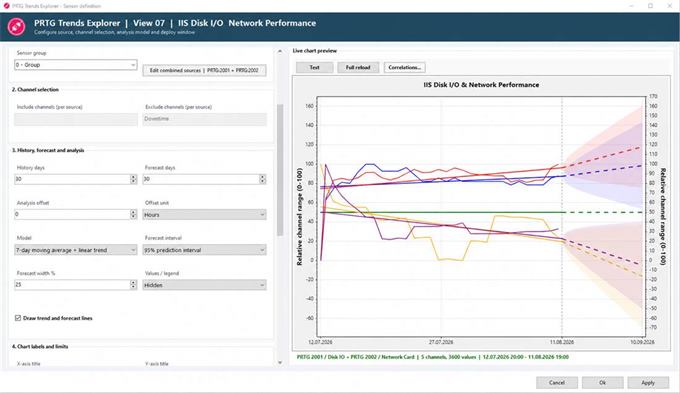
Forecast beyond the current moment
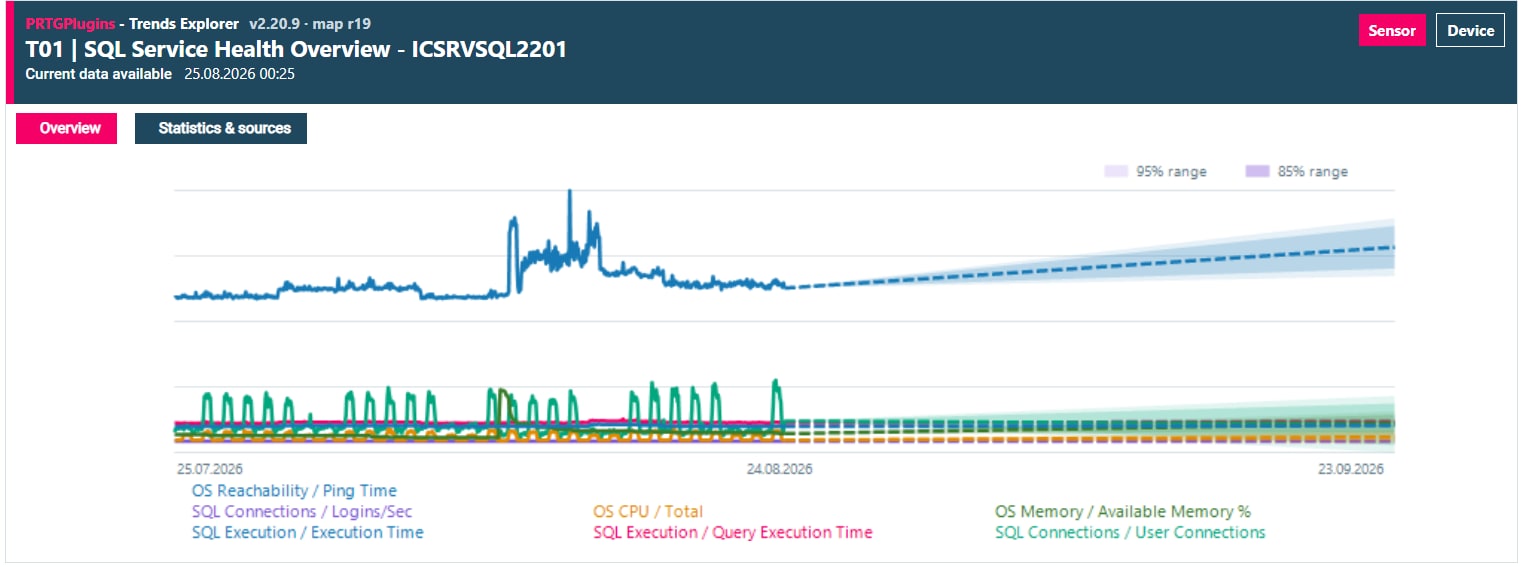
Every View is configurable. Select the relevant history, forecast horizon, analysis offset and model, then inspect the chart before accepting the result.
AI assistance with human control
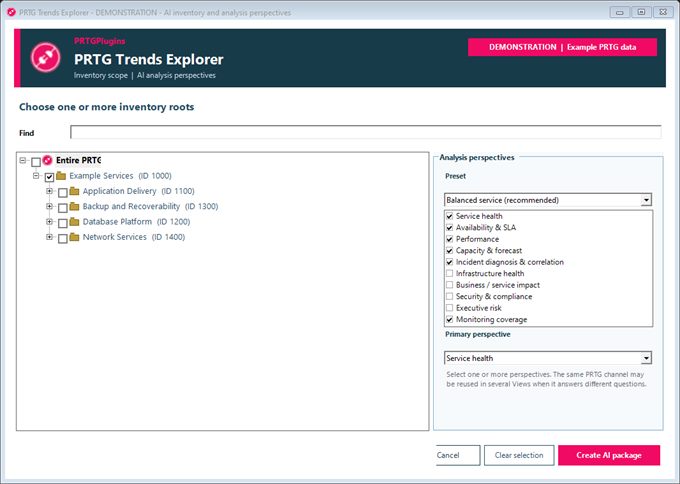
Package a selected, structured PRTG inventory for AI analysis. Ask for clearer service Views, useful channel roles, per-channel objectives, analysis models, monitoring gaps and duplicated signals. Work manually with an AI service you already use, or configure a supported provider for an automatic exchange.
Teams and multiple configurations without identity confusion
Manage more than one Trends configuration from the Configurations workspace. Use local, shared or network locations, name and describe each configuration, switch the active context and clone a configuration into a separately identified Engine instance. Each configuration keeps its own stable identity, Views and deployment scope.
The same PRTG source sensors can support several teams wherever their data is relevant to each team’s own service. A team does not have to adopt every channel from a shared sensor: it can select only the channels that explain its service, combine them with other sources and govern them with its own channel objectives, forecast models and approved thresholds inside its own configuration.
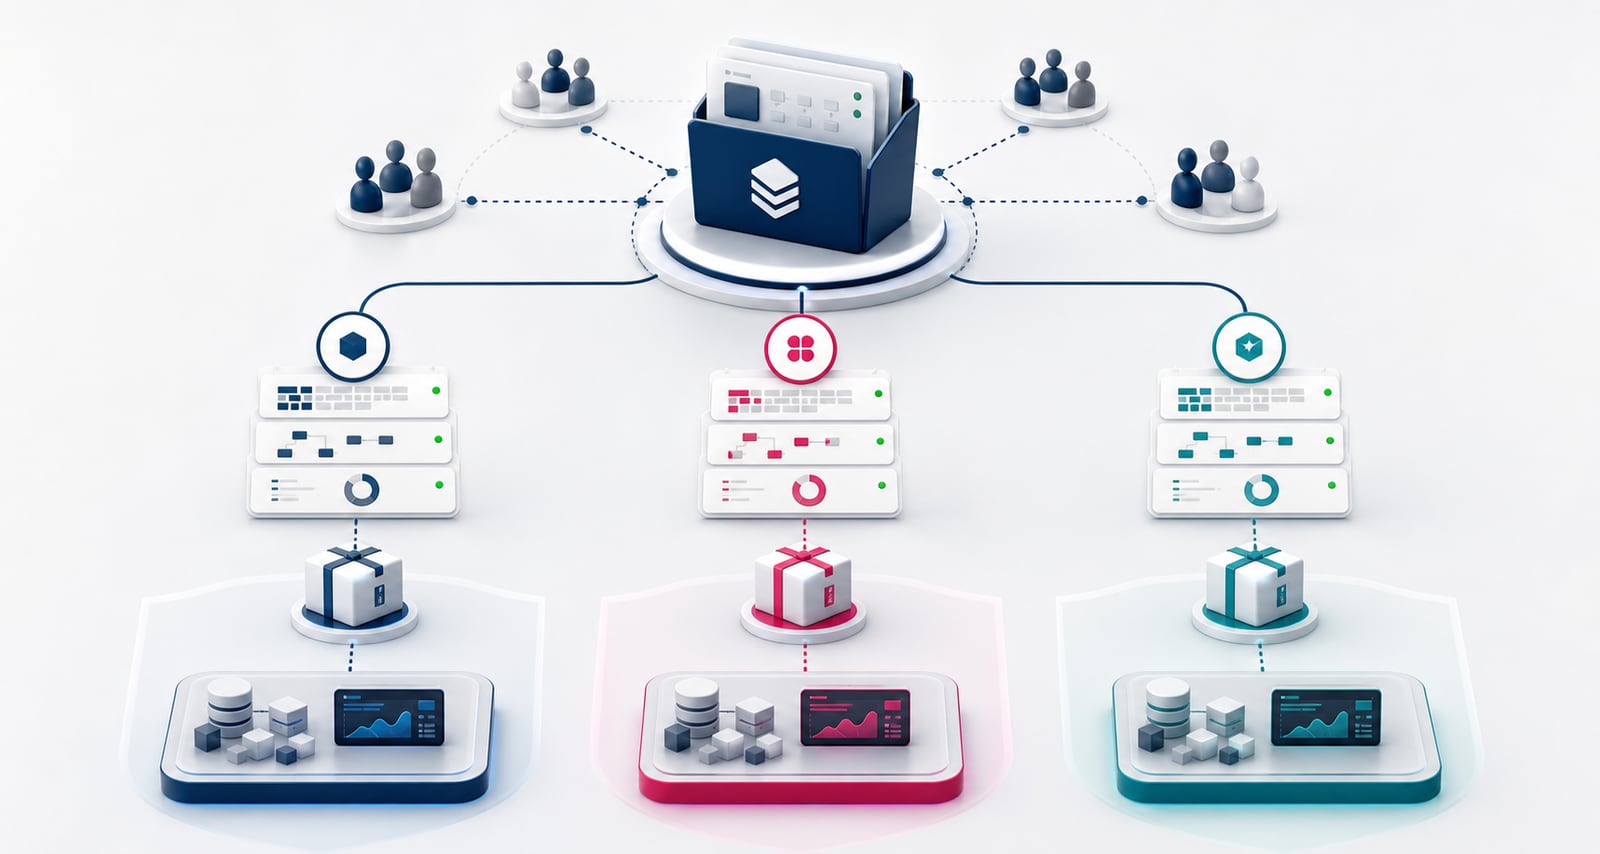
A platform team can use host CPU, memory pressure and cluster capacity channels from a Hyper-V sensor with infrastructure-level warning limits. An application team can reuse the same sensor but select only the VM availability, storage latency or resource-pressure channels relevant to its application service. Both teams start from the same PRTG evidence, yet build different Views and approve thresholds that reflect their own responsibilities — without duplicating the source monitoring.
Deploy approved insight through a workflow that guides you
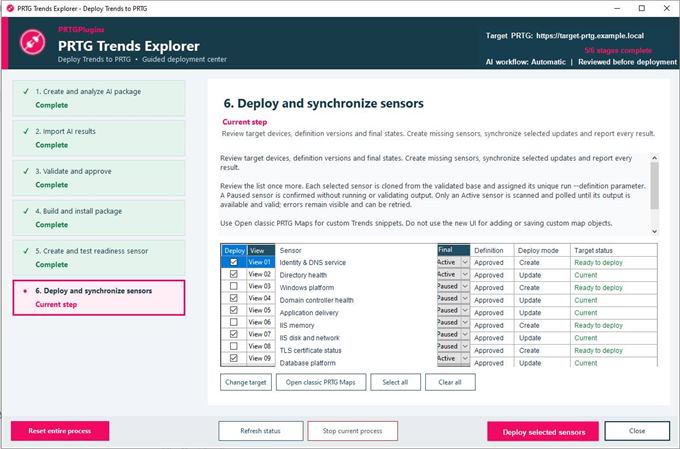
Desktop leads you through six resumable stages: choose what will be published, review and approve objectives, check readiness, build the Engine Installer, verify the Engine and synchronize the selected Trends sensors and Maps. Each stage explains what is needed, checks the current state and lets you continue from the last completed point.
Custom Sensors\EXEXML. AI credentials and provider connections are never included in this operational package. Return to Desktop: the workflow verifies the installed Engine and continues with sensor and Map deployment.Do Desktop or AI need to stay running? No. Once deployed, the Engine runs autonomously at the Probe, reads the configured source PRTG data and produces the approved Trends results inside PRTG using its packaged statistical logic. Reopen Desktop — and optionally use AI again — only when you want to review, refine or redeploy the configuration.
- Read-only readiness checks before target changes
- Clear approval and publication-scope gates
- Version and package-state verification
- Resumable progress across the Desktop and Probe hand-off
- Identity-aware updates with explicit impact when replacement is unavoidable
Keep foresight visible inside PRTG
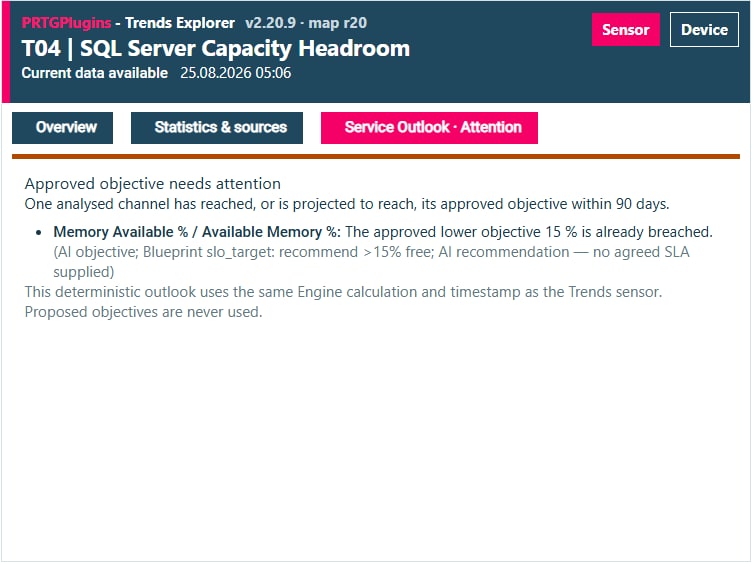
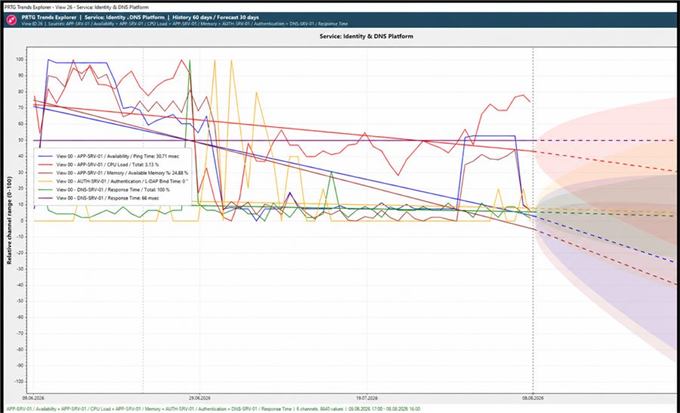
The Engine keeps every approved View alive inside PRTG. The Trends sensor is the numerical monitoring and alarm object: it carries the calculated channels, including Days to threshold and Breach probability wherever an approved objective applies, while PRTG owns channel limits and notifications. The matching Map component presents the same Engine result as a multi-channel forecast, a traceable threshold table and a plain-language Service Outlook.
Built for practical, repeatable foresight
The result is a repeatable operating model: inventory, understand, design, govern, deploy, measure, predict and learn. New measurements improve the next iteration while the evidence remains visible.
- Statistics-first operation with optional AI assistance
- Traceable sources, provenance and explicit confidence
- Reusable Views for different services and audiences
- Controlled proposals, approvals and deployment scope
- Multi-configuration operation for growing environments
Learn. Refine. Evolve.
PRTGPlugins Trends Explorer turns monitoring history into a clearer view of where your services are heading — and what deserves attention next.
PRTG reads your past. Trends Explorer tells your future.
No crystal ball. Just your data — refined into foresight.