
🚀 PRTG Trending & Baselining Tool
Enables powerful trending insights in your PRTG Network Monitor.
- Capacity management for any PRTG sensor
- Integrated with PRTG Maps and Reports
- Visual GUI views for NOC operators
📊 Overview
PRTGPluginsGUI complements our PRTGPlugins suite with advanced Baselining and Trending capabilities using data from any PRTG sensor.
The tool helps anticipate resource saturation based on configurable measurement periods:
- Long term: 1, 3, 6 months
- Short term: 7 days, 2 weeks, 1 month
🔧 Operation Modes
- Dash Board Mode – Visualize live and historical data using predefined views. Works with read-only PRTG access.
- Map Integration Mode – Use the trending graphics directly inside PRTG Maps for enhanced visibility.
- Reporting Integration Mode – Add trend graphics and data into native PRTG reports (7d/30d templates provided).
🖥 System Requirements & Setup
- Install on a dedicated PRTG Remote Probe (not internet-facing)
- .NET Framework 4.5+ required (3.5 also recommended for full compatibility)
- PRTGPluginsGUI should be placed in:
Custom Sensors\EXEXML - Create a
.iniconfiguration file to define your trending views - Ensure file permissions for PRTGProbe (e.g., access to
\Webroot\mapobjects) for reporting & maps
📁 View Configuration Parameters
- Sensor ID: Unique ID of the PRTG sensor (from browser URL)
- View Type: e.g., 0 = Baseline, 7/14/30/90 = Trend days
- Polling Interval: Refresh time in minutes
- Include / Exclude Channels: Comma-separated channel names
- Y-Axis / X-Axis Titles: Customize chart labeling
- Trend Lines / Show Legend: On/Off options per view
📊 Sensor Output Interpretation
Each data channel includes 3 values:
- 0-ChannelName: Starting value (past)
- 1-ChannelName: Current trend value (today)
- 2-ChannelName: Projected value (future)
This gives a full backward and forward-looking view within a single sensor.
🗺 PRTG Map & Report Integration
- Create a Custom EXE/Script Advanced Sensor in PRTG
- Use parameters like:
-i:"C:\path\to\your.ini" -v:0 -o:30 -s:%sensorname -mp
- Enable report integration by including these sensors in the default or custom templates
⚠️ Limitations
- Max 16 channels per view (up to 32 lines visualized)
- Max 50 views per INI file
- Grouped views in PRTG only supported in Baseline mode (no historic data)
Product transition
PRTGPluginsGUI is moving into Trends Engine
PRTGPluginsGUI is the proven predecessor of PRTG Trends Engine. New GUI licences are no longer sold through automated checkout. Trends Engine is now in a closed pilot while its governed objectives, forecasting, Views, deployment workflow and PRTG integration are validated with selected environments.
Want to take part? Apply by email, or enable Website chat in Cookie settings, open the chat bubble and send: Apply to Trends Engine closed pilot. Existing GUI customers can use the same channels for licence questions.
👥 Target Audiences
- NOC teams: Real-time baseline views on big screens
- IT managers: Long-term service monitoring and planning
🧭 Use Modes
1. Graphical Views for Trending
Ideal for NOC dashboards and management trend forecasting:

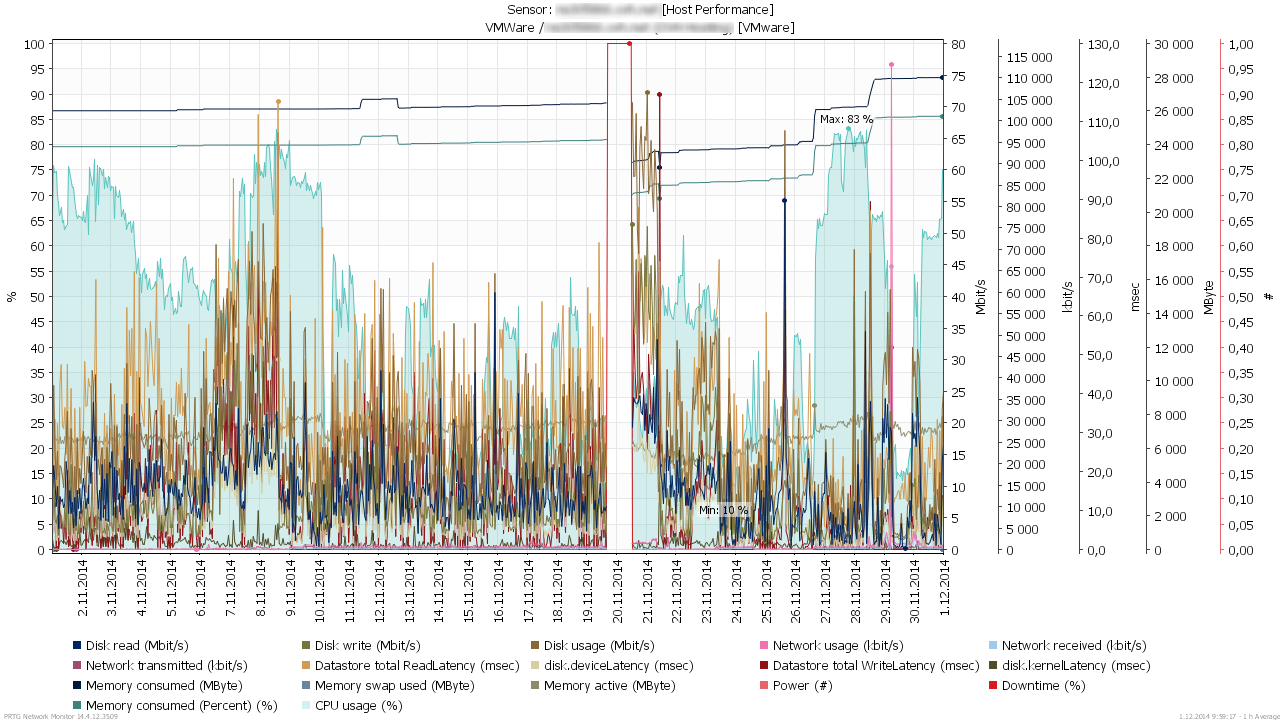
Example 1: PRTG 30-day native view
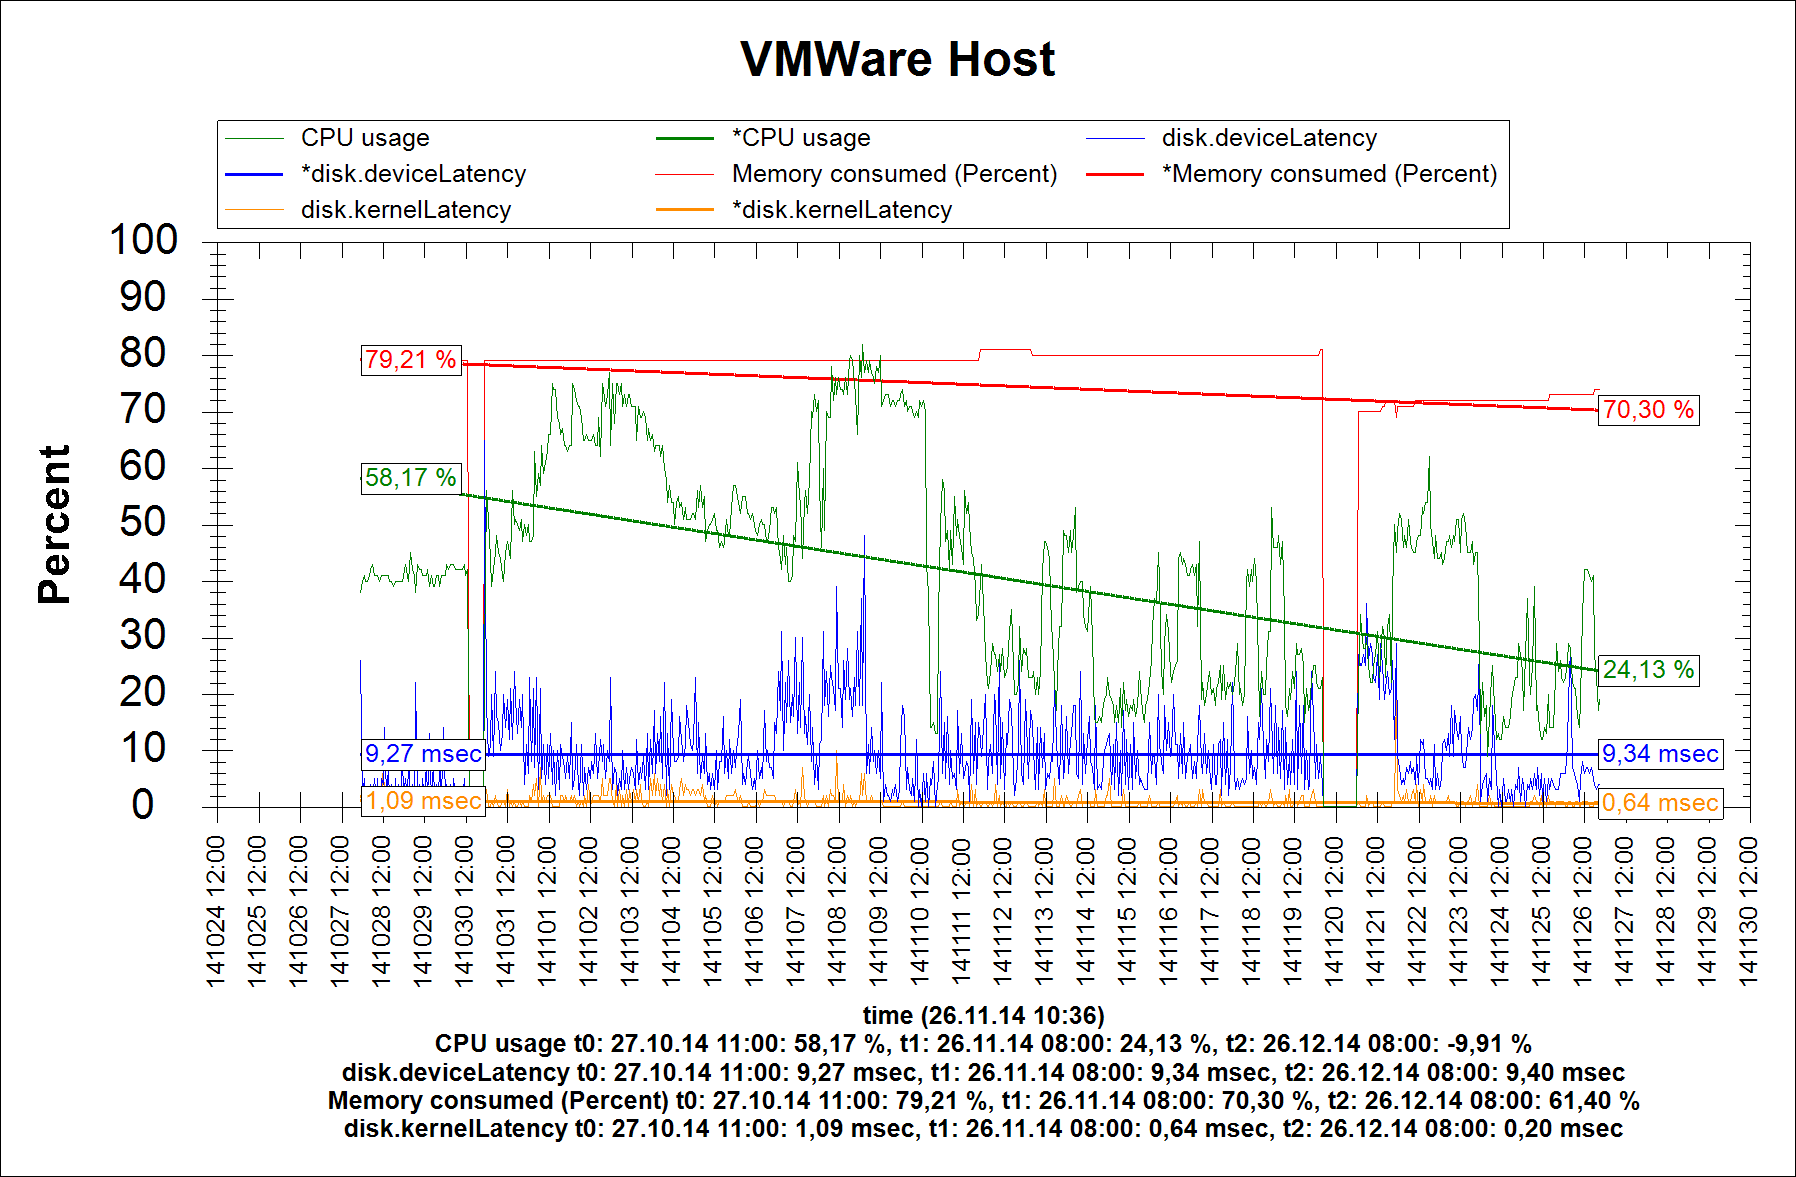
Example 2: PRTGPluginsGUI 30-day view without trend lines
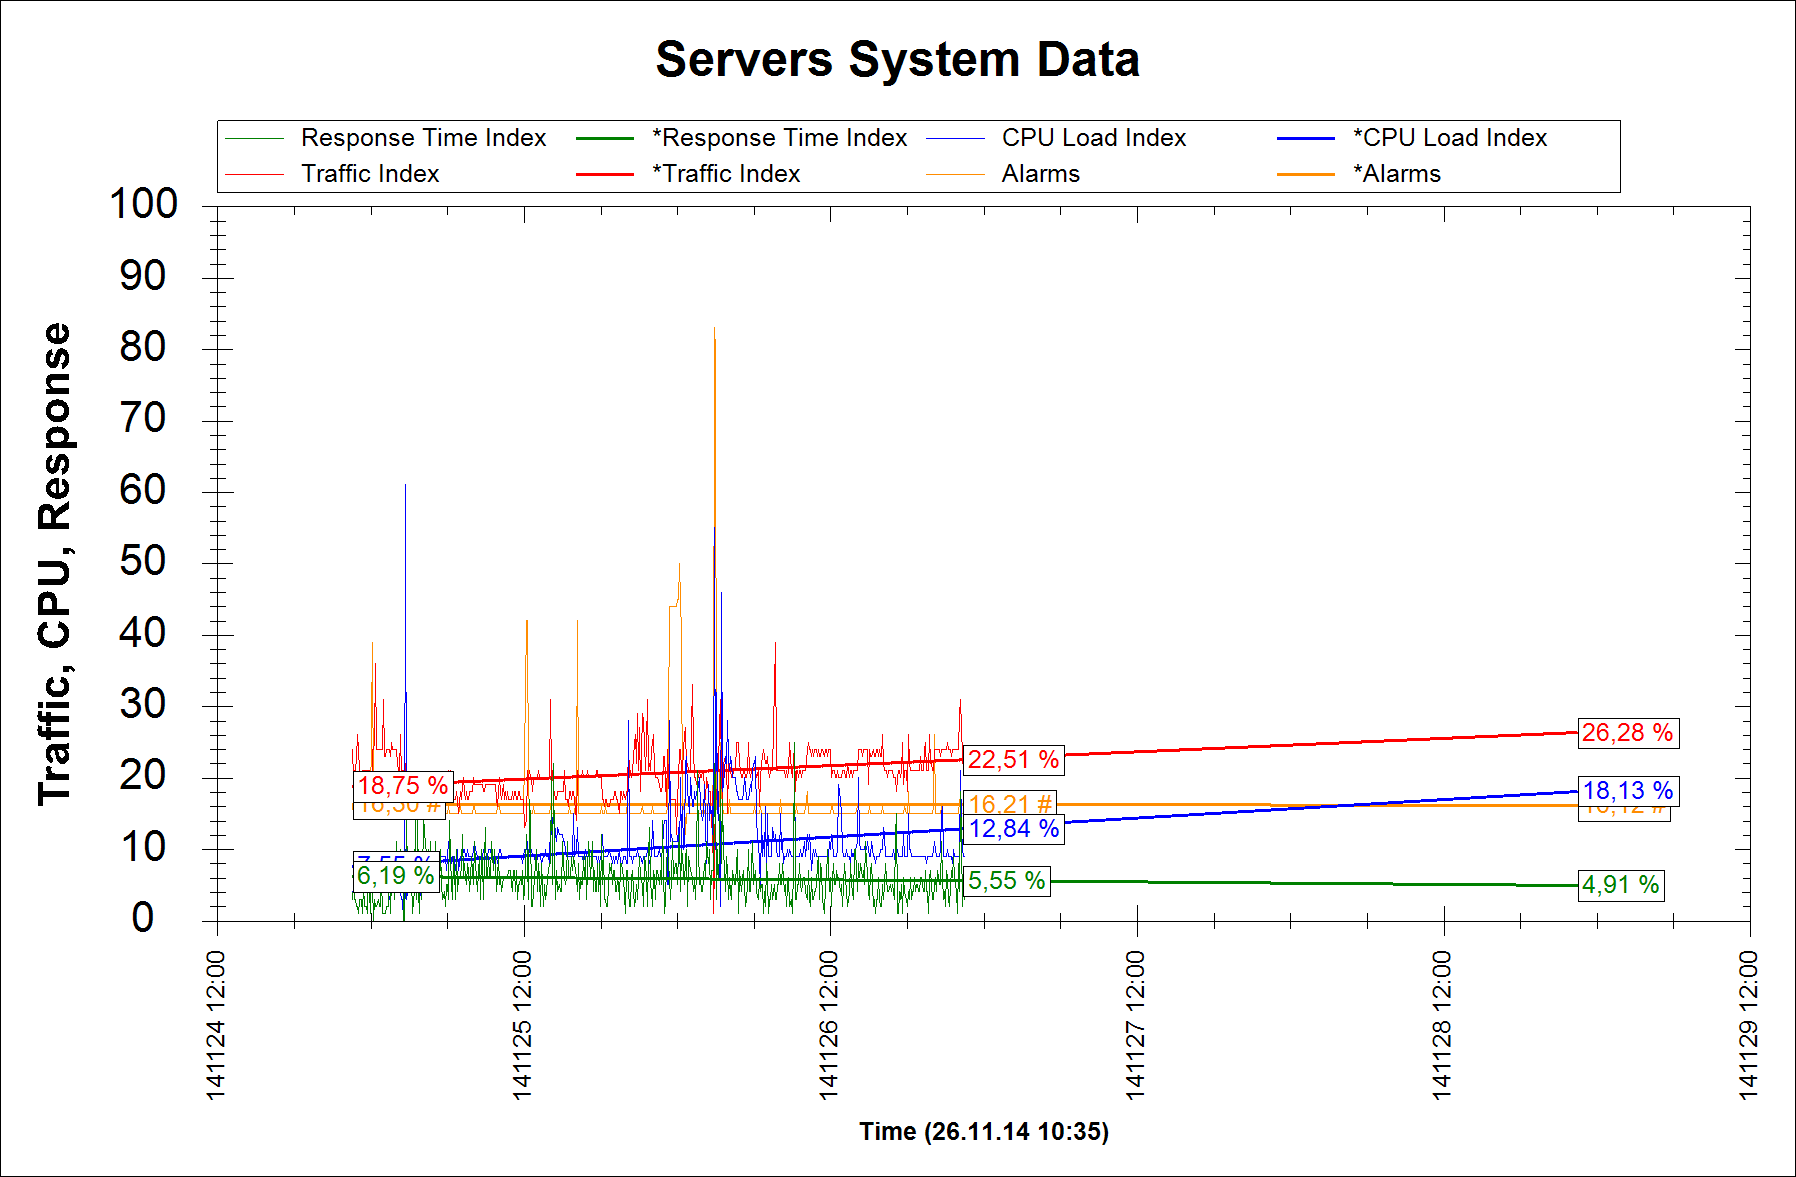
Example 3: Same with trend lines


2. Loop-Back Data to PRTG
Send calculated trend data back to PRTG for historical reporting and dashboards:

Example: Looping 7 and 14 day data to PRTG from a different view type:

3. Online Graphics for PRTG Maps
Feature under development – coming soon.