🖥 Complete Citrix Monitoring with PRTG Plugins
Gain full-stack visibility into your Citrix environment—covering infrastructure, performance, user experience, and delivery layer. PRTGPlugins provide comprehensive, role-based monitoring tailored to Citrix administrators.
- 🔍 Monitor server performance with context-aware metrics
- 👤 Simulate user sessions to proactively identify experience issues
- 🌐 Monitor NetScaler (ADC) health and configuration integrity
The PRTGPlugins suite empowers IT teams to monitor Citrix XenApp and XenDesktop environments in real time. By bridging gaps left by native tools, these plugins offer enhanced observability across user, server, and network levels. Leveraging PRTG’s robust sensor engine, they deliver high-granularity data without requiring complex setups—making it suitable for both SMB and enterprise environments. Typical deployments remain cost-efficient, with pricing often under €30/month.

🔎 Note: The RDPmonitor sensor output may vary depending on Citrix version. See the Admin Guide for compatibility matrix and configuration notes.
✅ Supported Citrix Versions: From legacy Metaframe 4.x to the latest XenApp/XenDesktop 7.x builds, including Citrix Virtual Apps and Desktops 1912/2203 LTSR editions.
🧩 Modular Architecture: Three Specialized Monitoring Plugins
To ensure deep diagnostics without overloading your monitoring setup, the suite is modular. Each plugin targets a specific domain—optimizing data relevance and sensor efficiency.
Server Performance
- Farm-wide CPU, memory, and session metrics
- Per-role performance (e.g. StoreFront vs Delivery Controller)
- Application enumeration and instance tracking
- Error and logon issue tracing
- ICA session quality and latency statistics
- HDX channel-specific performance (USB, printing, video)
User Session Simulation
- Scheduled logon simulations from test clients
- Logon, launch, and session startup time tracking
- Screenshot-based verification (e.g. application launch)
- Alerts based on thresholds or timeouts
NetScaler Monitoring
- Monitors active sessions and SSL offloading performance
- Alerts for certificate expiry and SNI issues
- Visibility into load balancing, failover, and gateway status
- Instant detection of configuration drift and HA mode changes
🔍 In-Depth: Citrix Session Monitoring
Citrix Session Monitoring with PRTG Plugins
⭐ Key Features Overview
- Session Performance Monitoring with Screenshots & History – Track every stage of the user session, complete with visual documentation for troubleshooting and proof.
- Citrix/XenApp Health Monitoring – Ensure the entire virtual app infrastructure is operating reliably under expected load and response times.
- License Server Usage Monitoring – Monitor available vs. consumed license pool to forecast needs and avoid service denial.
📌 NOTE: This plugin operates in direct mode to ensure session simulations occur exactly as a user would experience. Therefore, the probe must have direct network access to all target publishing servers.
🖥️ Session Monitoring Details
🔍 Why Session Monitoring Matters
Citrix Session Monitoring gives IT teams visibility into the actual user experience, not just backend server stats. By simulating real sessions and capturing login times, application launches, and even screen views, administrators can:
- 🎯 Proactively detect performance issues – Spot slow logons, delayed app launches, or intermittent session drops before users complain.
- 📸 Provide forensic evidence – Session screenshots offer visual proof of issues or behavior for troubleshooting or audit purposes.
- 📊 Measure service quality – Quantify logon durations, session lengths, and ICA responsiveness to improve SLAs and capacity planning.
- 💬 Reduce support tickets – By identifying errors (like app failures or stuck logins) before users report them, you save time and reputation.
- 🧠 Understand user experience holistically – From the moment a session begins to logout, every step is accounted for, enabling full-stack optimization.
- ICA connection time – Measures time to establish a session channel.
- ICA login time – Detect delays during credential verification and profile loading.
- Published Application Tracking:
- Launch time with recording – Records how long it takes to start the app, with visual log.
- Screenshot saving – Captures real user views at session start.
- History view – Browse session snapshots for forensic or UX reviews.
- Session logoff time – Detects abnormal delays in closing sessions cleanly.
- Error count – Provides a quick indicator of session reliability over time.
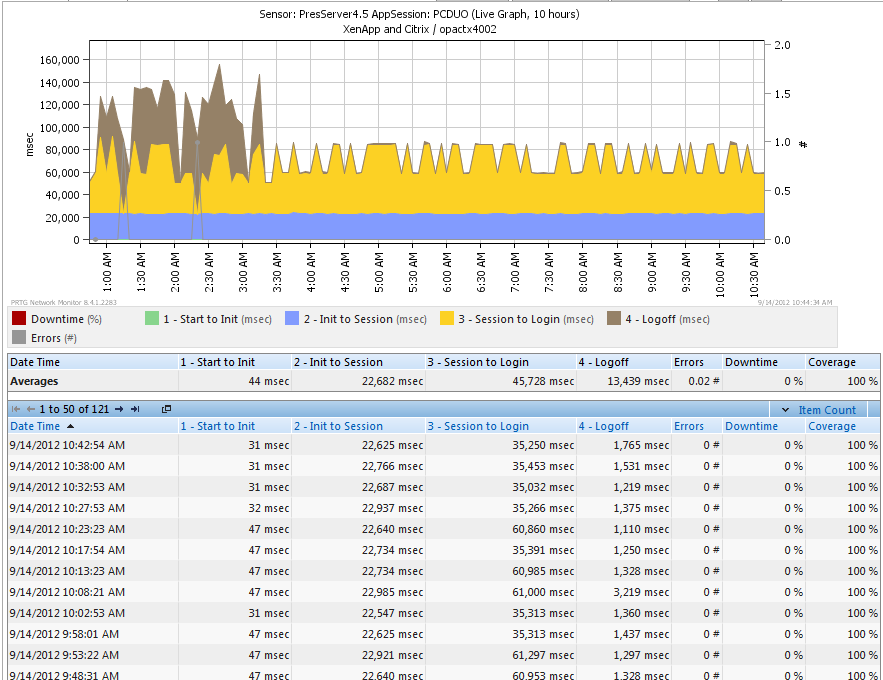
📊 Session Simulation Reporting Timeline
This schema shows each reported metric during a session simulation test.

🗺️ PRTG Map Integration Example
Visualize session data, screenshots, and KPIs in a consolidated dashboard view using PRTG Maps.

📊 In-Depth: Citrix Performance Monitoring
Citrix Performance Monitoring with PRTG Plugins
📡 Citrix XenApp Performance & Health Monitoring
Gain full visibility into your XenApp infrastructure with deep-dive metrics, session diagnostics, and performance intelligence.
- 🔧 ICA Session & Metadata Counters – Track session quality and detect bottlenecks in real-time.
- 🔐 Secure Ticketing Authority Metrics – Ensure seamless and secure session initiation.
- 🌐 IMA Networking & Licensing Health – Maintain backend communication and avoid licensing outages.
- 📊 XenApp Server Load & Session Trends – Balance user load and plan for scaling.
📈 XenApp 7.6 Performance Metrics
Live monitoring of publishing server sessions:
- Network & bandwidth usage – Diagnose congestion and optimize delivery.
- Roundtrip latency values – Identify lag sources in end-user experience.

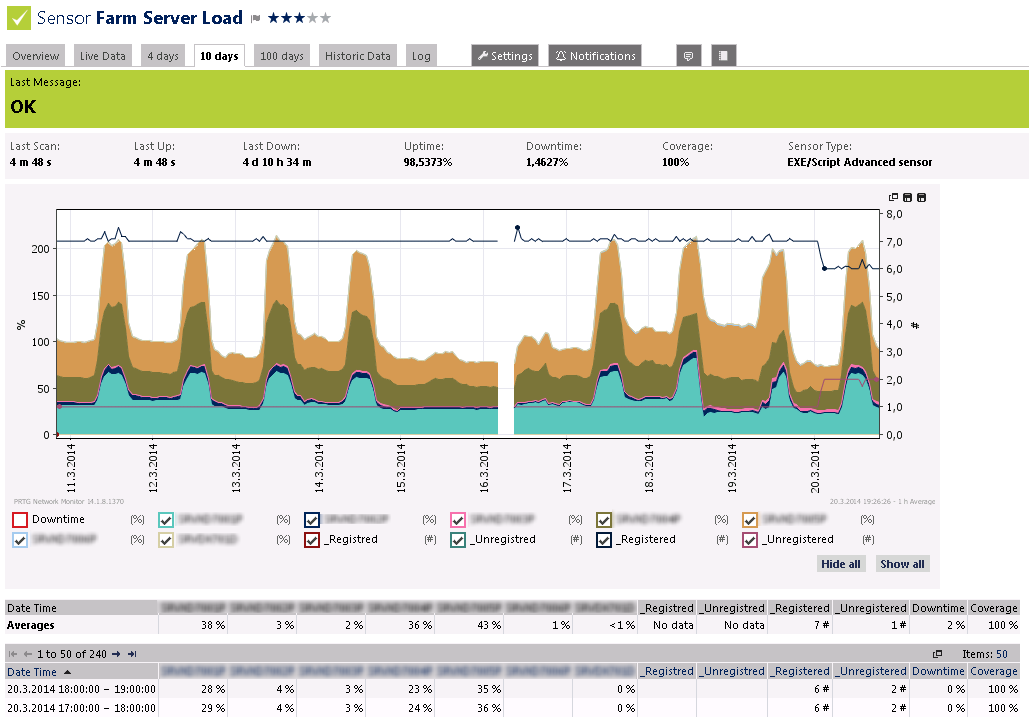
🌍 XenApp 7.6 Farm Load Monitoring
Track Citrix server loads and monitor registered/unregistered servers. Helps identify underutilized or unavailable nodes in your farm.


🧠 Monitoring Citrix Control Hosts
Detect and resolve session creation issues:
- Slow session start identification – Prevents user frustration and escalations.
- Unsuccessful session creation alerts – Pinpoint root causes quickly.
Correlate data with ICAmonitoring plugin output for deeper insights.
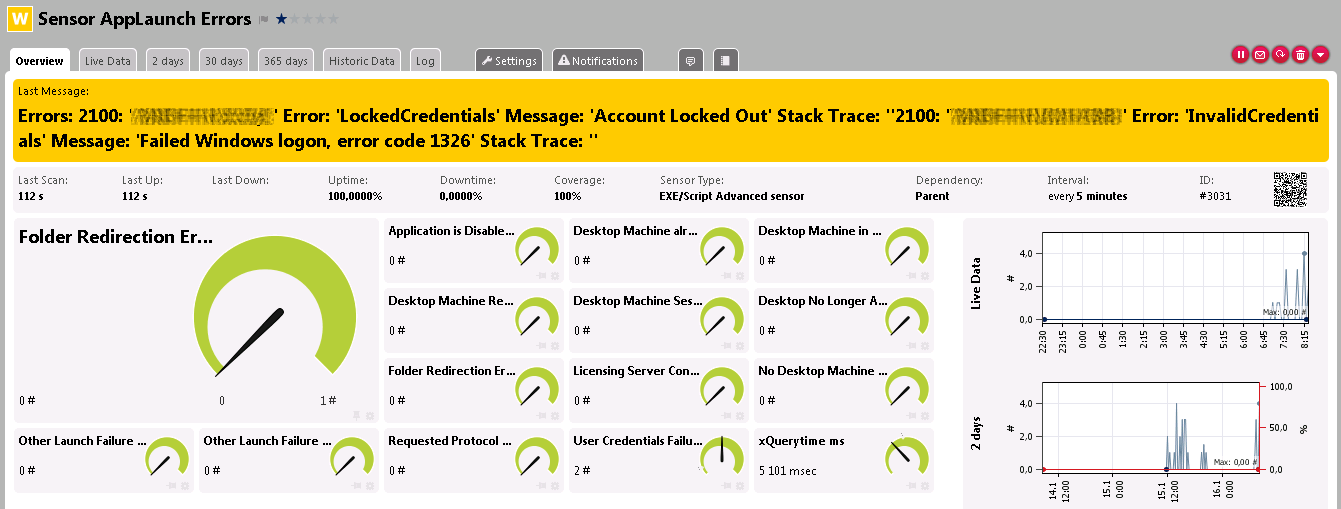
⚠️ Intelligent Error Reporting
Receive real-time alerts of failed or delayed logins. Allows proactive support and reduces ticket volume.


🗂 Application Monitoring
Available from XenApp 6.5 and above
Monitor published applications in real-time from every XenApp server. Ensure delivery consistency and detect anomalies.

🚀 Citrix Logon Performance Insights
Analyze logon speeds per server and pinpoint slowdowns instantly. Crucial for user satisfaction and SLA compliance.

🕒 Example: Detected Slow Logons in Your Farm

🔐 Citrix Licensing Metrics
Live monitoring of licensing usage and expiration. Avoid user lockouts and maintain compliance.


🌐 In-Depth: Citrix NetScaler Monitoring
Citrix NetScaler Monitoring with PRTG Plugins
🌐 NetScaler Base Monitoring Sensor |
|
|
This foundational sensor replicates and extends the core information provided by the native NetScaler Dashboard—within the unified PRTG environment. It consolidates resource stats, session metrics, and load distribution without requiring ADC GUI logins. Use Case: Ideal for real-time overview and integrating NetScaler into NOC dashboards. |
 |
🔐 NetScaler Certificates Monitoring |
|
|
Continuously monitors all installed SSL certificates on your NetScaler instance. Each cert is listed by name and remaining validity (in days). A dedicated alert channel highlights the certificate with the fewest days remaining to prevent surprises from expired certs. Why it matters: Ensures compliance and prevents service disruptions due to expired SSL certificates. |
 |
📶 Load Balancing Virtual Servers Monitoring |
|
|
Monitor the operational state of each NetScaler load balancing virtual server, including:
This sensor uses PRTG lookup tables to deliver readable health statuses (e.g., degraded, optimal, failed). |
 |
🚪 Gateway Virtual Servers Status Monitoring |
|
|
Gathers health data for Gateway Virtual Servers and tracks concurrent AAA user sessions. This is critical for environments using NetScaler as a secure remote access or VPN solution. Benefits: Helps detect overload, unauthorized access patterns, or failed login surges in real time. |
 |
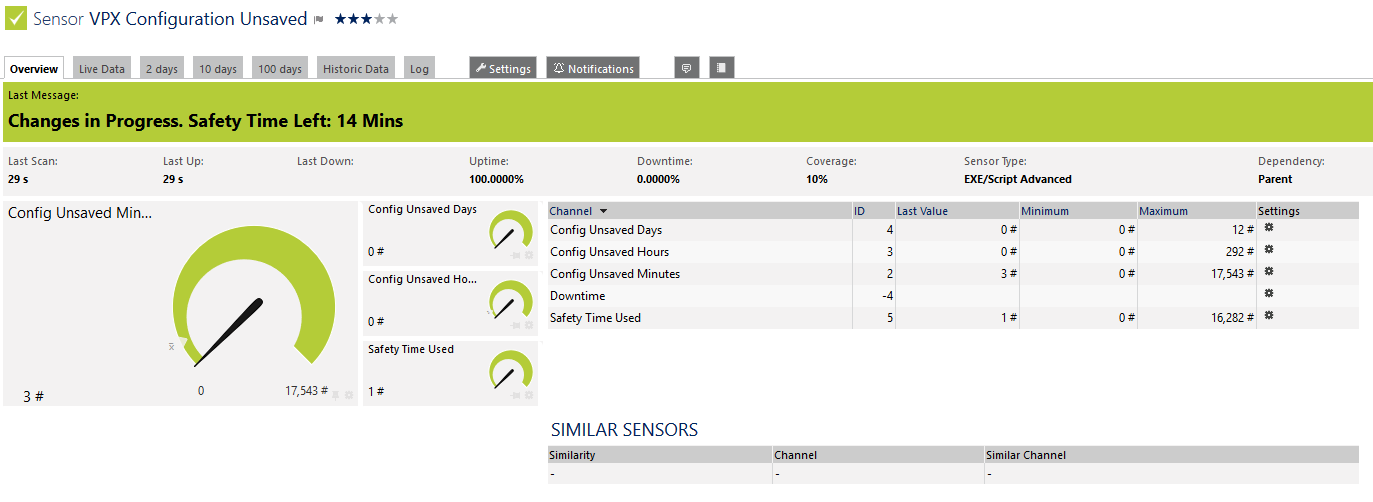
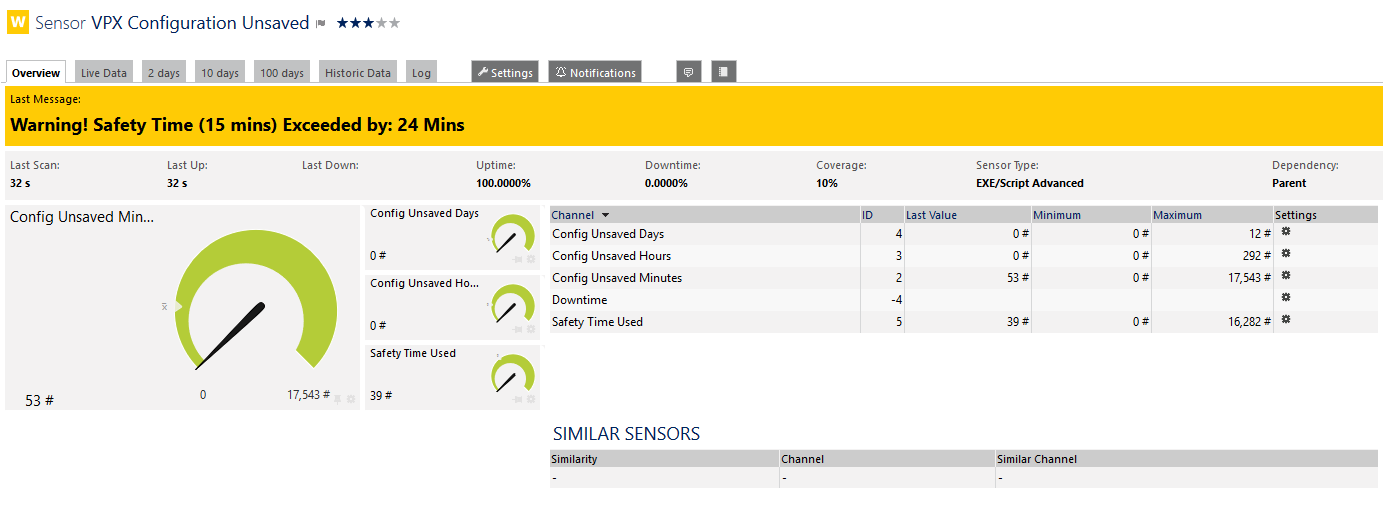
⚙️ NetScaler Configuration Changes MonitoringConfiguration drift is one of the leading causes of unplanned outages. The NetScaler Configuration Sensor helps enforce configuration hygiene through three modes: |
|
🔒 Monitoring NetScaler ModesLock critical settings (e.g., HA, L3 modes, routing) and receive alerts if they are changed. This creates a policy-driven approach to configuration management. |
 |
💾 Monitoring Unsaved ConfigurationsAlerts administrators when configuration changes remain unsaved past a customizable threshold. This feature is especially useful in HA environments where config sync failures may occur. |
   |
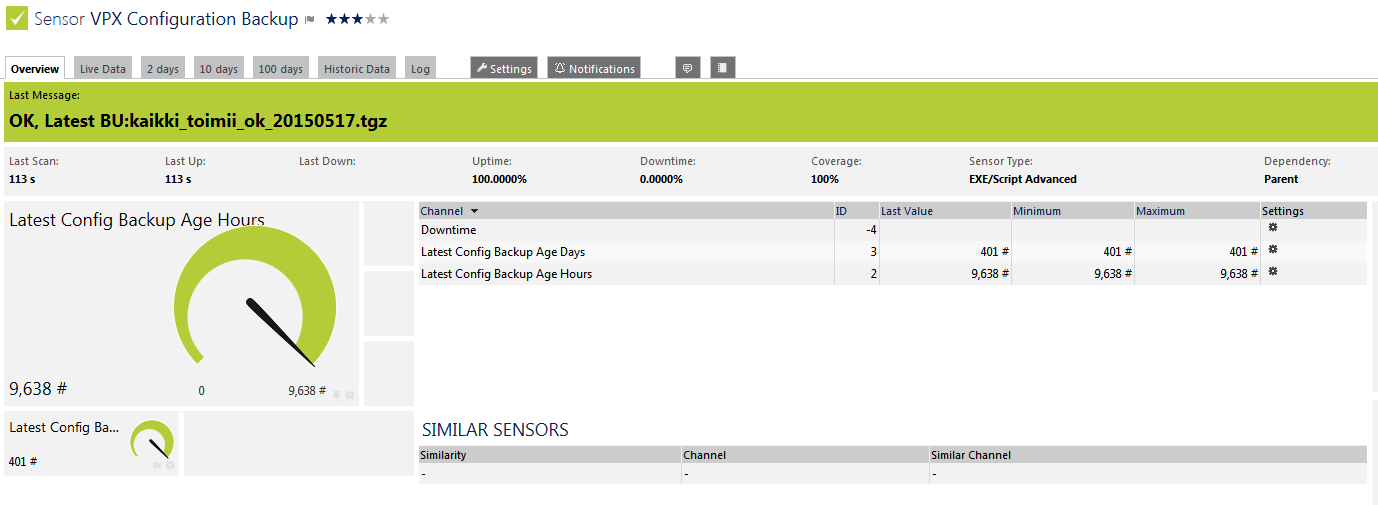
🗂 Monitoring Latest Backup AgeThis lightweight sensor keeps track of the most recent configuration backup by file name and age. Admins can define warning or error thresholds (e.g., no backup in 7 days) to enforce backup policies. Why it's useful: Easily integrate NetScaler backup compliance into overall infrastructure audit checks.
|
 |