
Use Case Concepts / Beyond IT
Wind Farm — Monitoring Beyond IT
Different measurements. Different objectives. The same goal-based approach to understanding where a system is heading.
A wind farm is more than a collection of independent turbines. This concept brings measurement history, approved operating objectives and the relationships between assets into one understandable view.
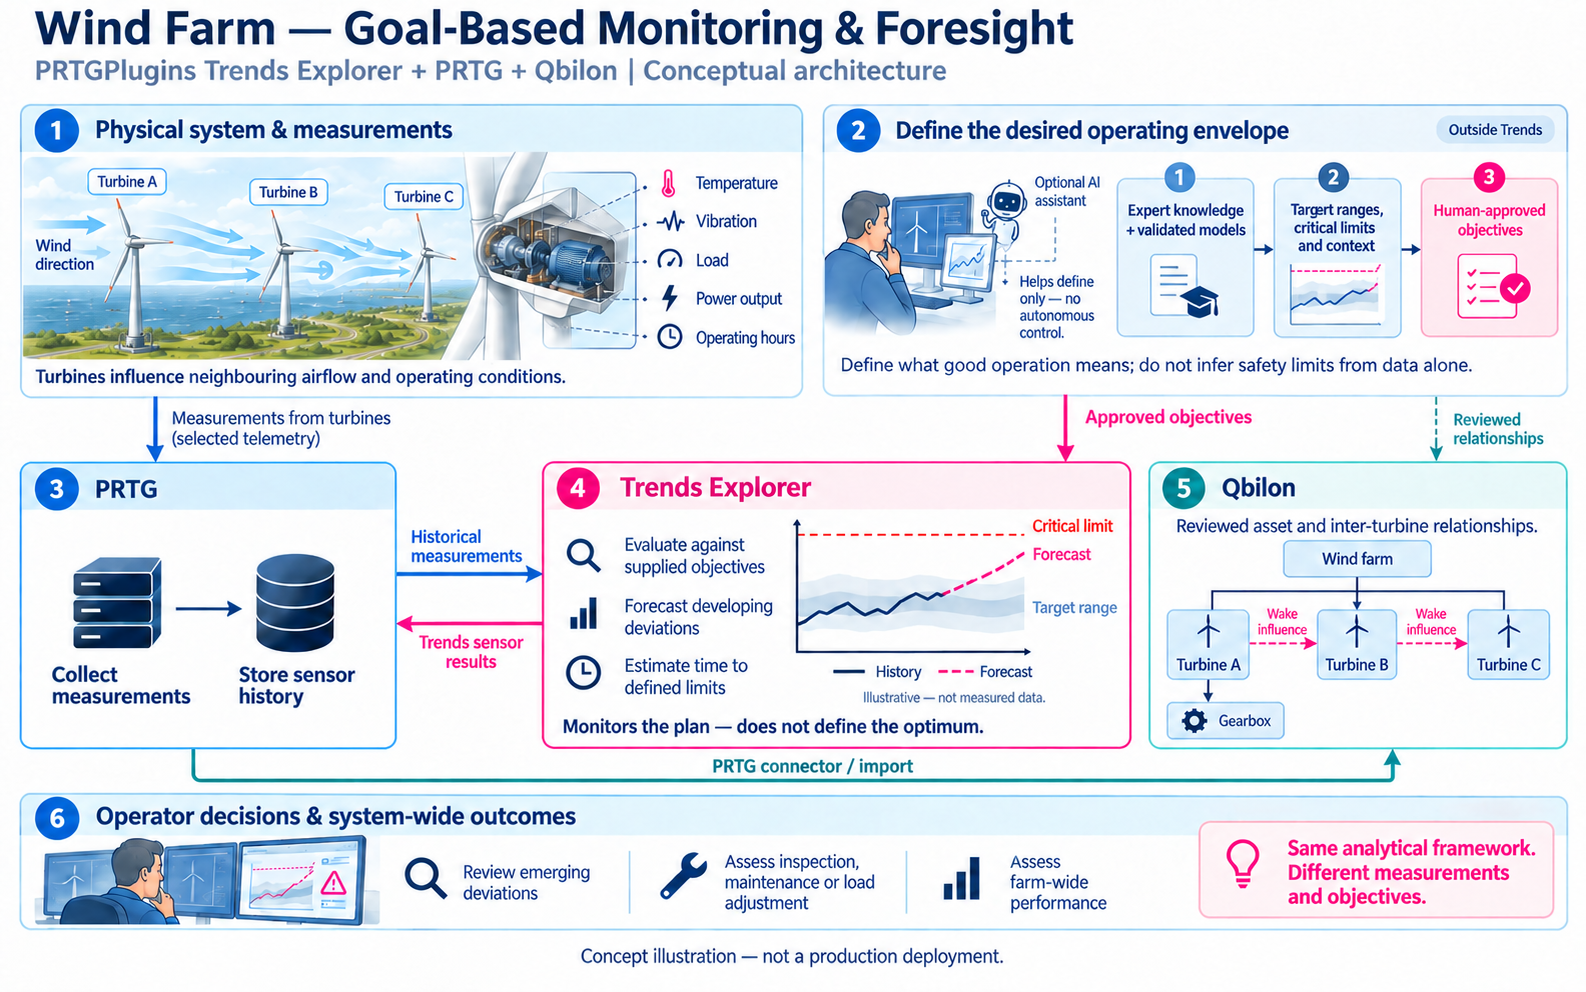
The concept, part by part
01 / Physical system & measurements
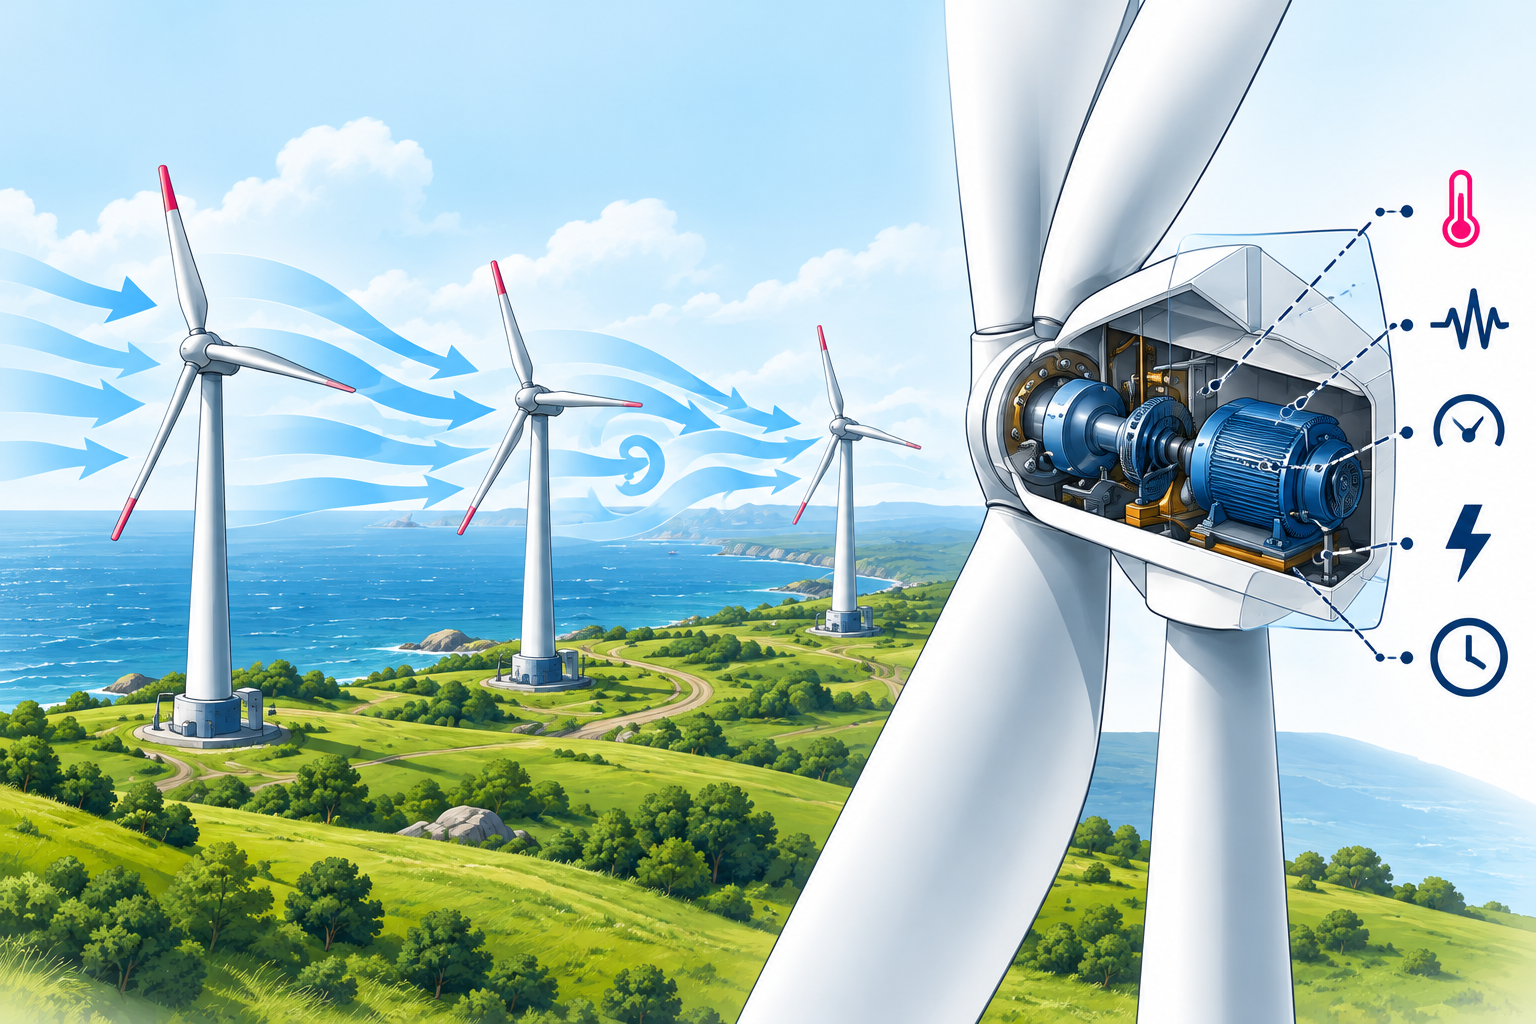
A wind farm is a connected physical system
Temperature, vibration, load, power output and operating hours describe different aspects of each turbine. Components support individual turbines, while neighbouring turbines influence one another's airflow and operating conditions.
02 / Define the operating envelope
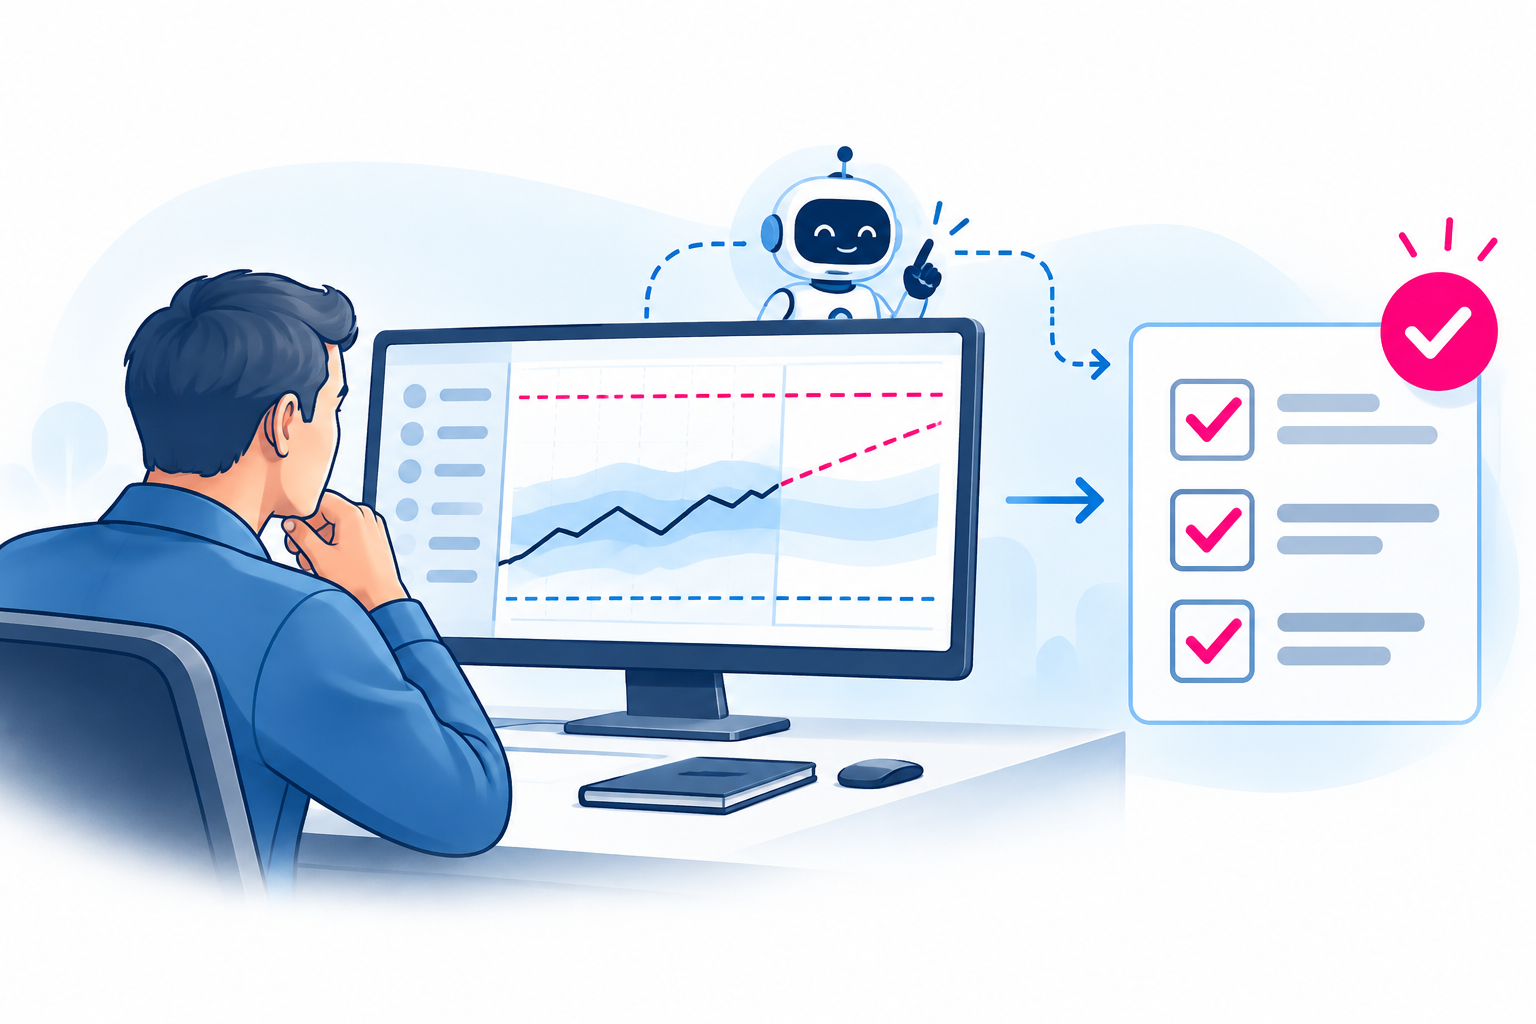
Agree what good operation looks like
Domain specialists define the relevant measurements, target ranges, critical limits and operating context. Optional AI assistance can help structure reviewable proposals. People approve the objectives before they are used for monitoring.
03 / PRTG
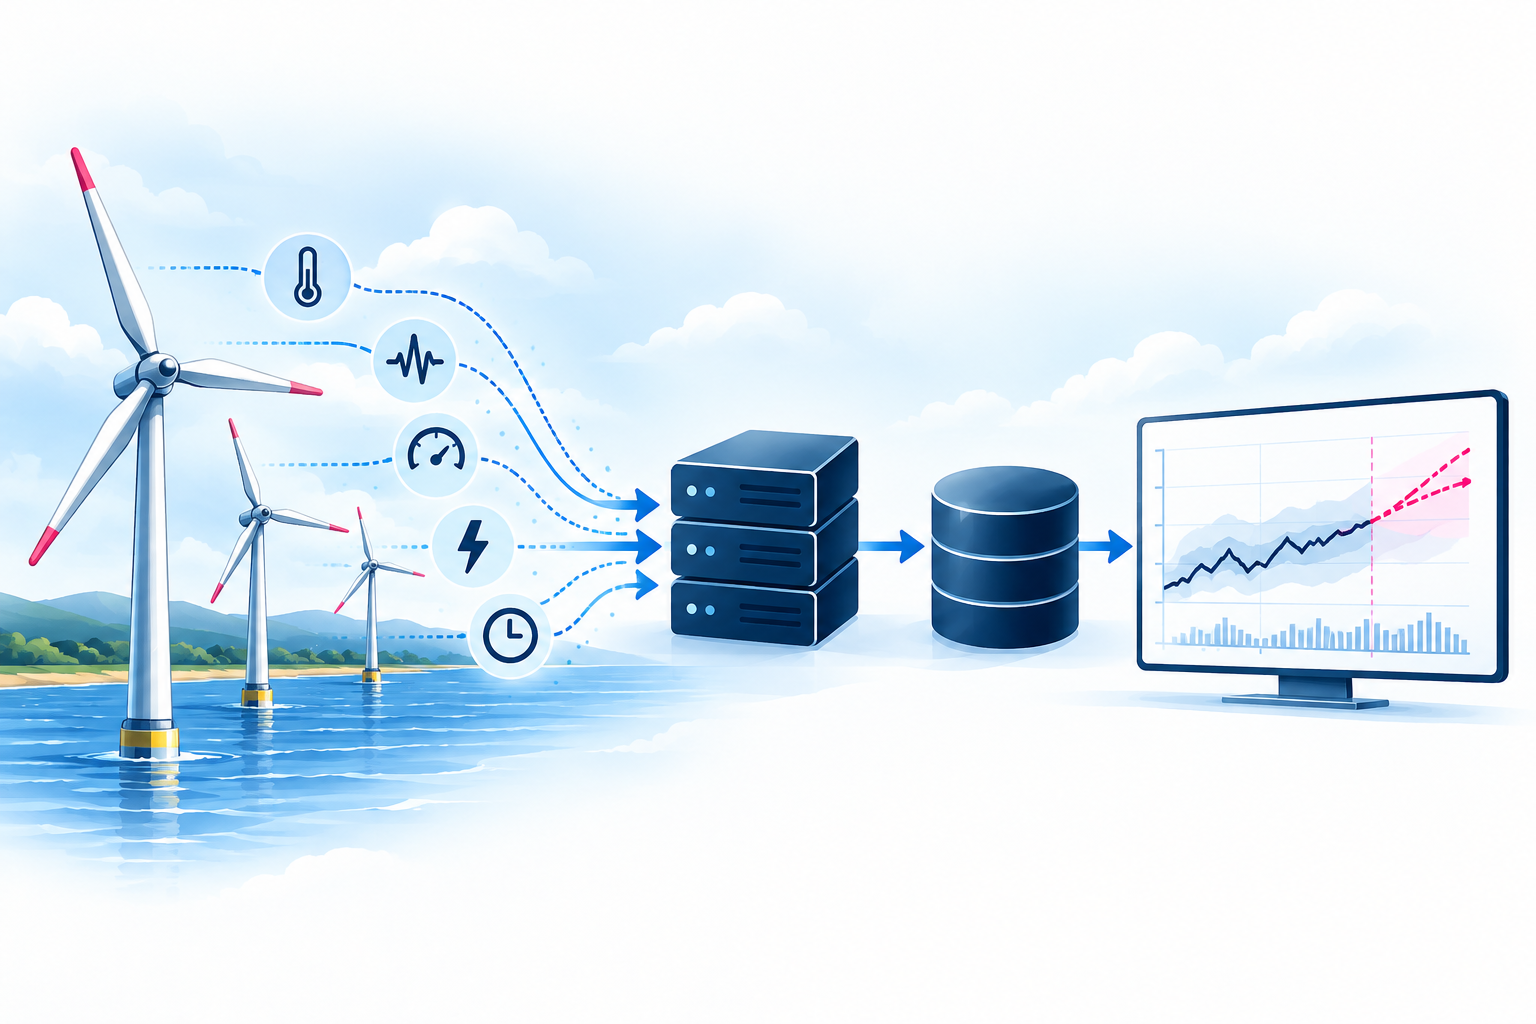
Collect the evidence and retain the history
PRTG collects the selected measurements and stores sensor history. That history provides the evidence for Trends Explorer's calculations. Calculated Trends sensor results return to PRTG, alongside the original measurements.
04 / Trends Explorer
Follow the trajectory against the plan
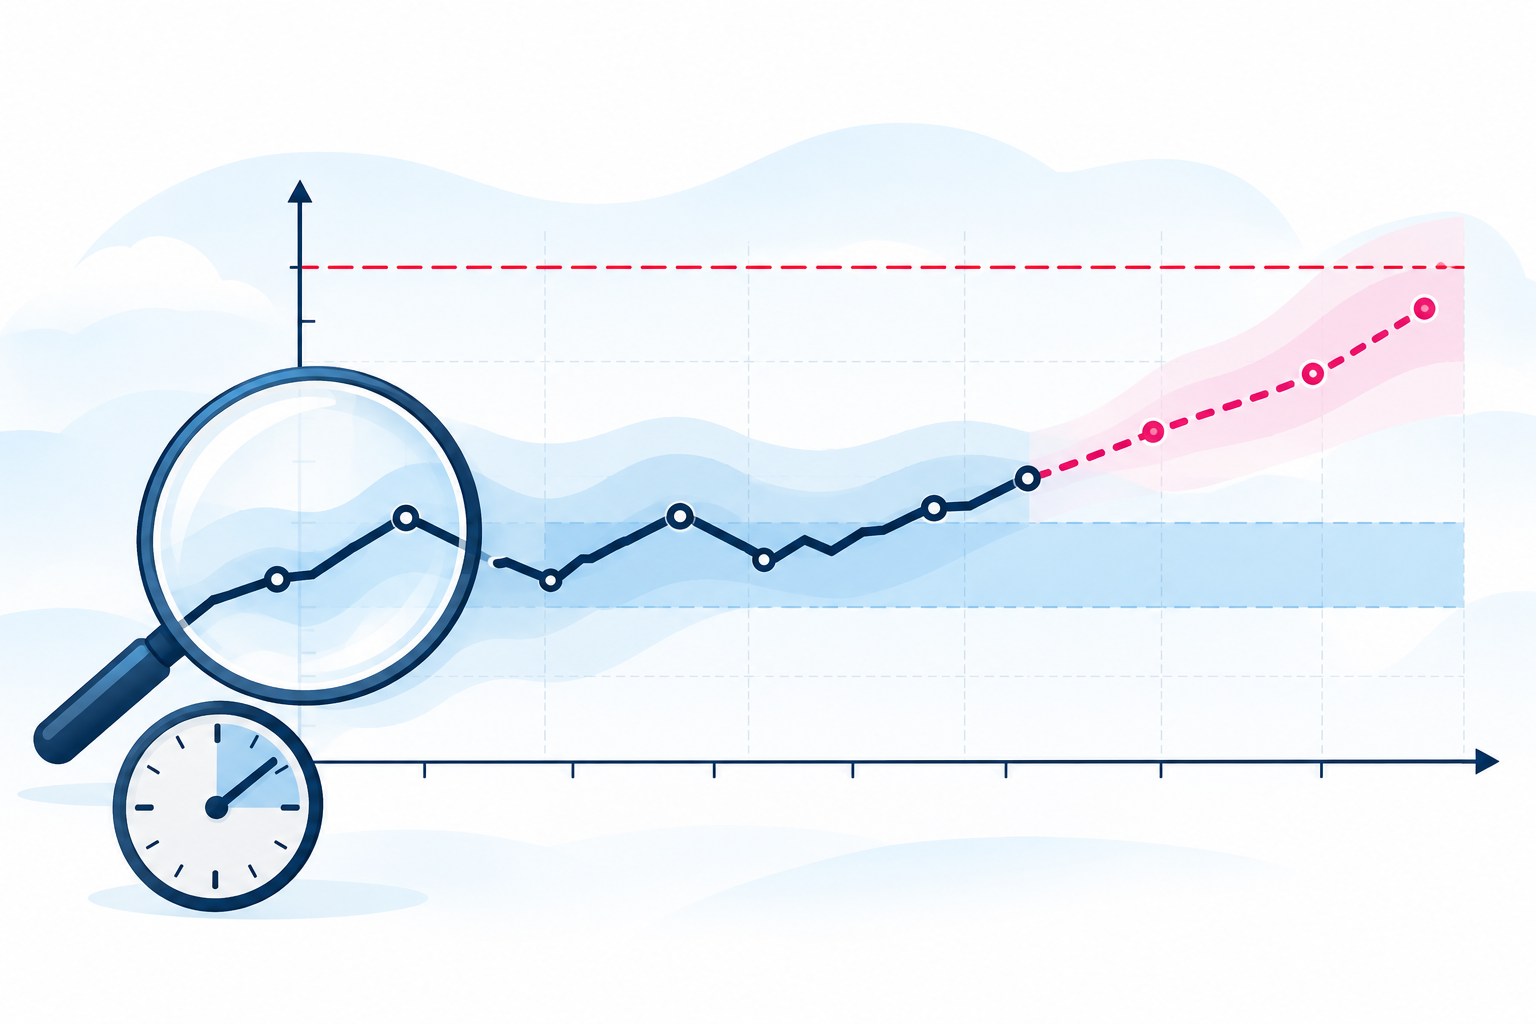
Trends Explorer evaluates the measurement history against approved objectives, identifies developing deviations and estimates when a defined limit may be reached. It monitors the supplied plan — it does not determine the optimum.
05 / Qbilon
See the relationships around a finding
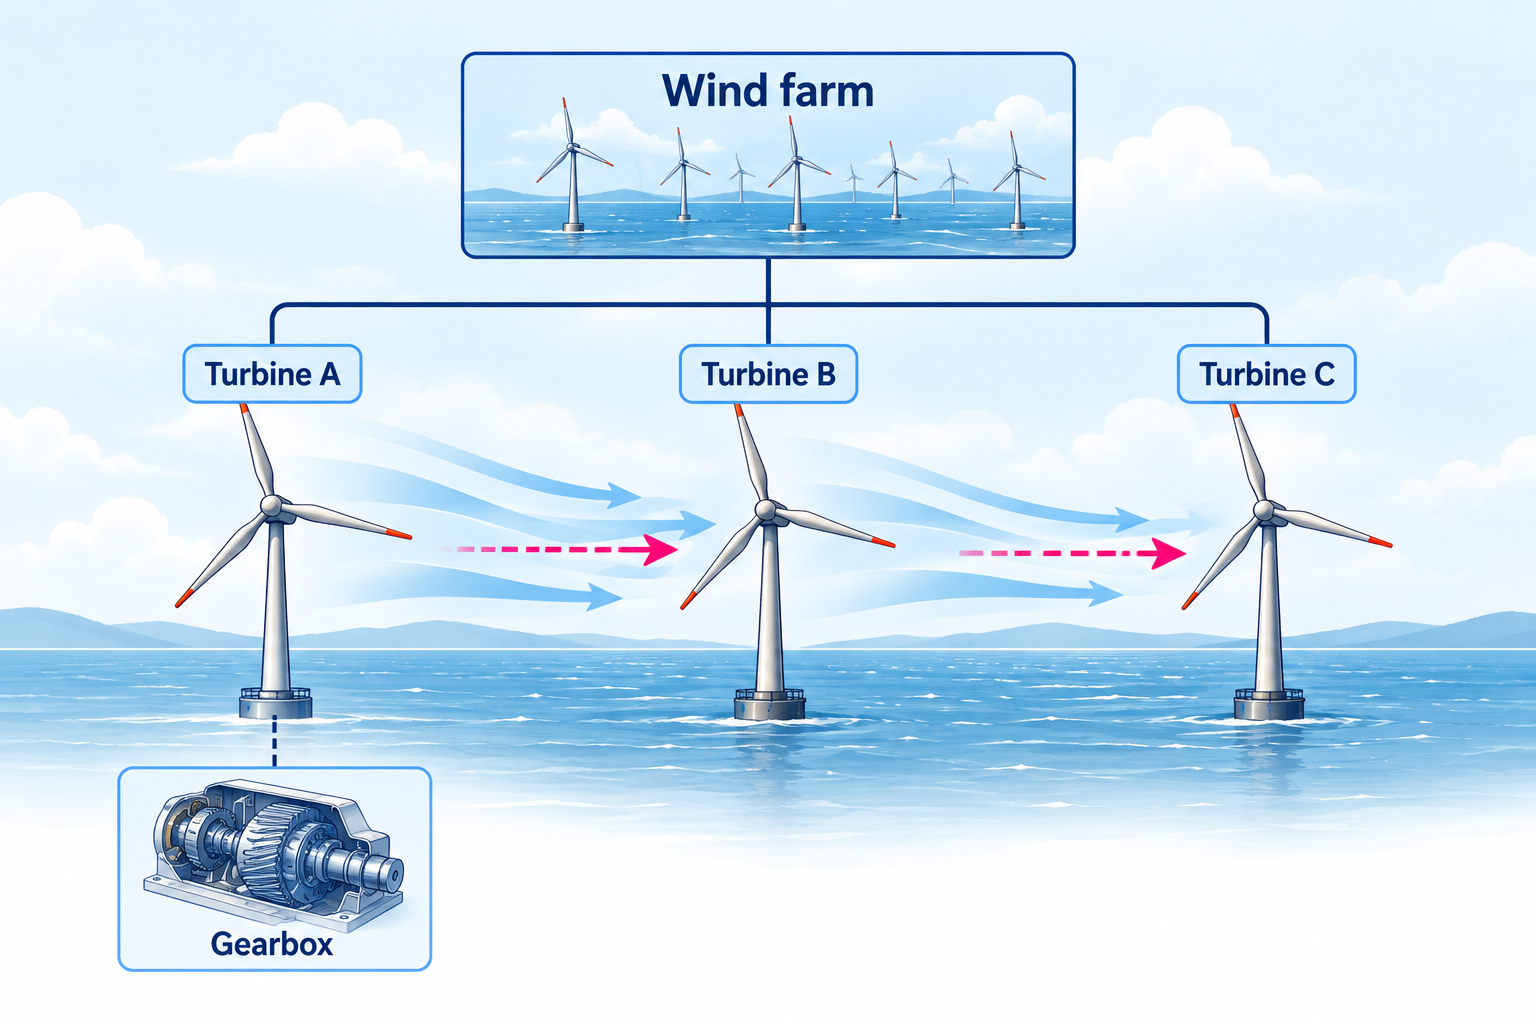
Qbilon visualises reviewed asset and dependency relationships: gearbox to turbine, turbine to wind farm, and wake influence between neighbouring turbines. PRTG imports bring monitoring results into this context, helping operators see more than an isolated measurement.
06 / Operator decisions
Turn foresight into informed action
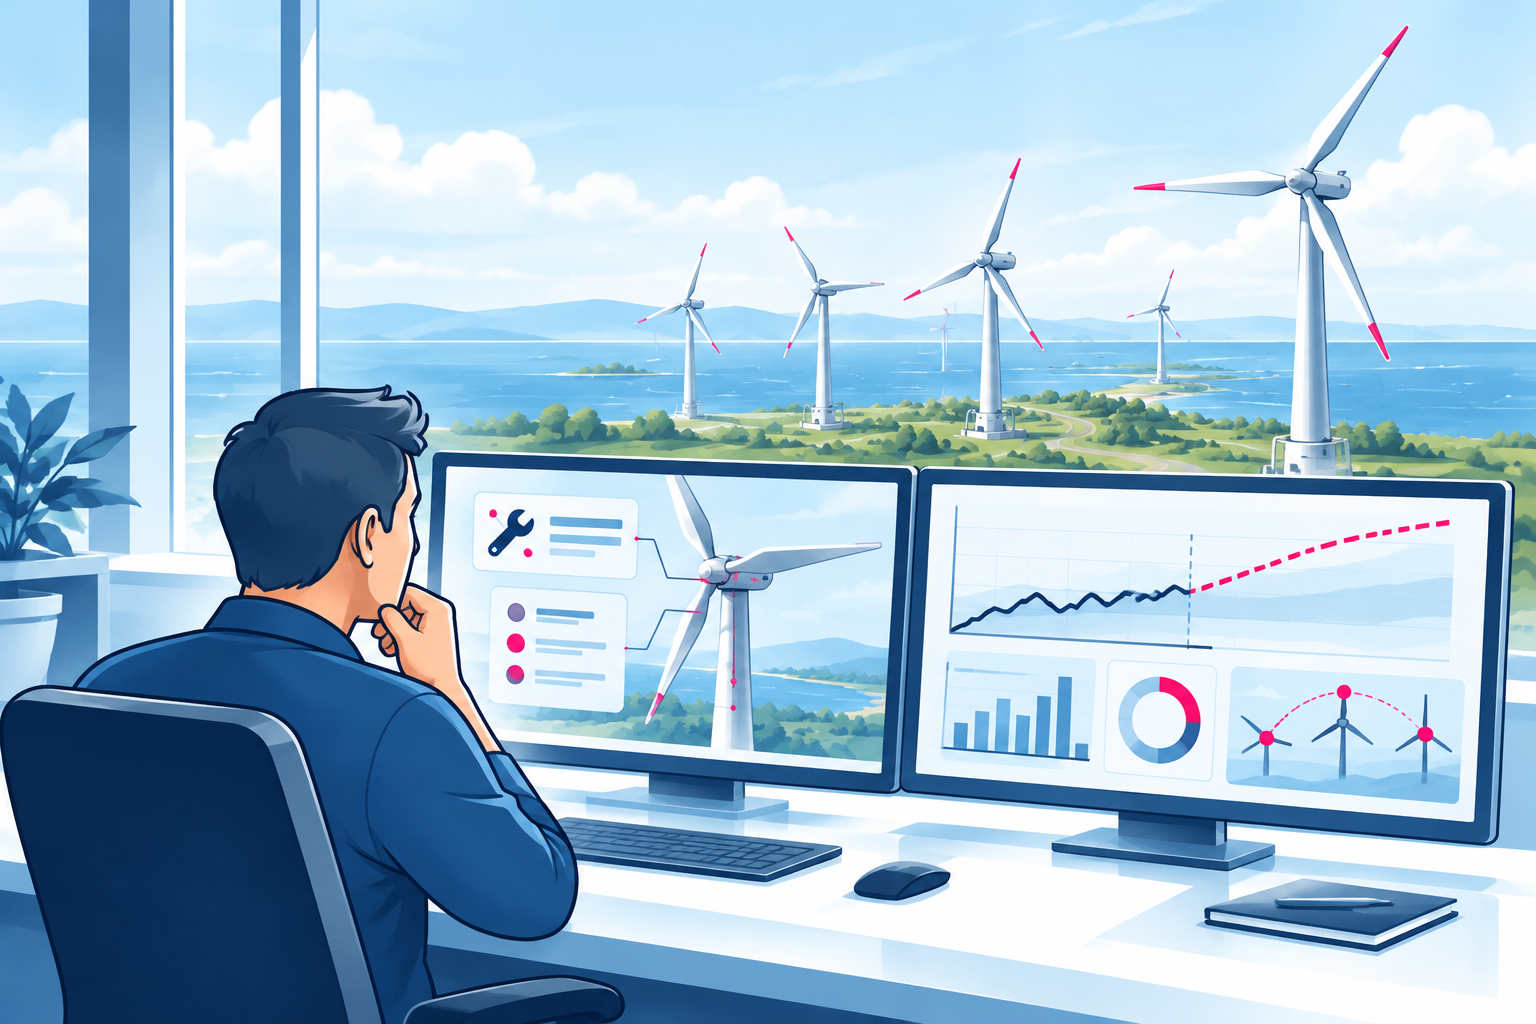
An emerging gearbox temperature trend can be considered alongside load, vibration and the turbine's place in the farm. Operators can then assess inspection, maintenance or an appropriate operational adjustment — and consider the implications for the wider farm.
Trends monitors the plan — it does not define the optimum.
The same concept can be explored wherever suitable measurements are available in PRTG and meaningful objectives can be defined. The starting point is the operational question, not the industry label.